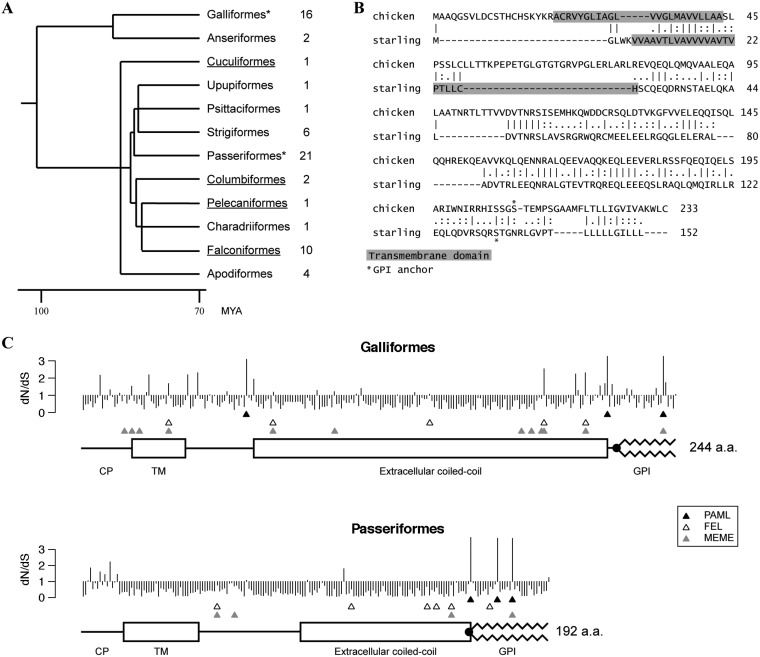
FIG 6.
Avian BST-2 orthologs and positive selection analysis. (A) A time-calibrated phylogeny of avian orders was generated in TimeTree (64). Only orders from which BST-2 sequences were analyzed are shown (other avian orders were not analyzed or the genomic data were not available); the number of species analyzed in each order is indicated on the right. The two orders we tested for positive selection are marked by asterisks. Underlining highlights avian orders which contain species previously considered to lack BST-2 orthologs. MYA, million years ago. (B) Pairwise sequence alignment of chicken and starling (Sturnus vulgaris) BST-2 amino acid sequences. Dashes represent gaps; bars, colons, and dots indicate identical, strongly similar, and weakly similar amino acids, respectively. The predicted positions of transmembrane regions and GPI anchor attachment (omega site) are shown. (C) The graph shows the estimated ratio of nonsynonymous to synonymous evolutionary changes (dN/dS) (posterior means, PAML’s model 8) at each codon position of BST-2 in aligned Galliformes and Passeriformes sequences. Three rows of triangles indicate sites identified by each algorithm as being under positive selection: the top row (▲) shows sites identified by PAML with BEB probability of ≥0.9, the middle row (△) shows FEL sites, and the third row (gray triangles) shows MEME sites. Protein sequence annotations below each graph were generated based on a single ungapped sequence for each alignment (G. gallus for the Galliformes, and S. vulgaris for Passeriformes), and coordinates were transformed to aligned coordinates.

