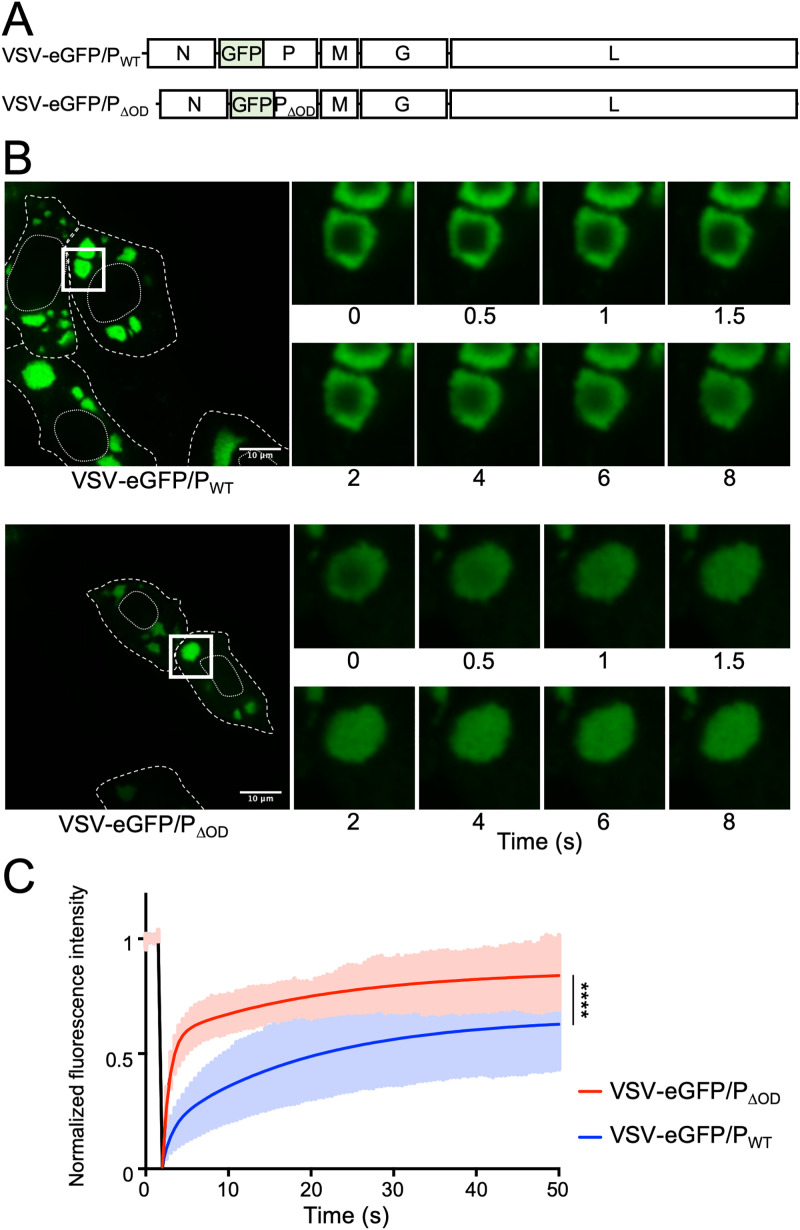
FIG 4.
FRAP analysis of replication compartments. (A) Schematic representation of the recombinant virus genomes. (B, C) Vero cells were infected at an MOI of 3 with VSV-eGFP/PWT or VSV-eGFP/PΔOD, and eGFP was visualized with a spinning disk confocal microscope at 6 and 10 h postinfection for VSV-eGFP/PWT and VSV-eGFP/PΔOD, respectively. Fluorescence recovery after photobleaching (FRAP) experiments were performed on areas of 4 μm2 located inside compartments. Recovery fluorescence was measured every 500 ms for 50 s. (B) Infected cells before photobleaching (left), and zoomed-in pictures taken at indicated times after photobleaching (right). Dashed and dotted lines delimit the cells and the nucleus, respectively. Squares represent the zoomed-in sections. (C) FRAP data were corrected for background, normalized to the minimum and maximum intensities. The mean is shown on the black line, with the gray zone representing the SD. Mean experimental curves were fitted with double-exponential models (red line; VSV-eGFP/PWT, R2 = 0.997; VSV-eGFP/PΔOD, R2 = 0.996). Statistical comparison of the two data sets was performed using the Kolmogorov-Smirnov test. P < 0.0001.

