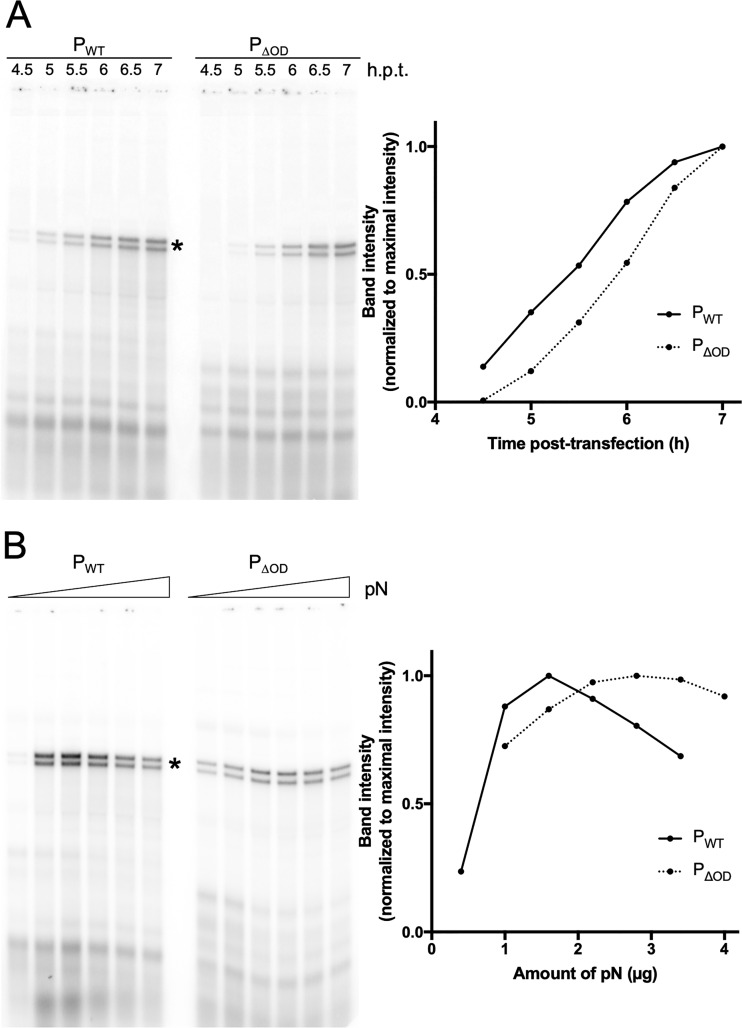
FIG 5.
Effect of PΔOD on viral RNA synthesis. (A) BSR-T7 cells were infected with DI-T for 1 h and transfected with plasmids coding for L, N, and PWT or PΔOD. At 1.5, 2, 2.5, 3, 3.5, or 4 h posttransfection, cells were incubated for 3 h in phosphate-free media supplemented with radioactive [32P]orthophosphate and 10 μg/ml actinomycin D. RNA was harvested and analyzed on a 1.75% agarose gel containing 6 M urea (left). DI-T band intensities were quantified and plotted as percentage of maximal intensity (right). Times of harvest posttransfection are indicated. DI-T bands are marked with an asterisk. Representative experiment (n = 4). (B) BSR-T7 cells were infected with DI-T for 1 h and transfected with plasmids coding for L, N, and PWT or PΔOD. Increasing amounts of plasmid coding for N were transfected with 0.4, 1, 1.6, 2.2, 2.8, and 3.4 μg for PWT and 1, 1.6, 2.2, 2.8, 3.4, and 4 μg for PΔOD. Five hours posttransfection, cells were incubated for 3 h in phosphate-free media supplemented with radioactive [32P]orthophosphate and 10 μg/ml actinomycin D. RNA was harvested and analyzed on a 1.75% agarose gel containing 6 M urea (left). DI-T band intensities were quantified and plotted as percentage of maximal intensity (right). Representative experiment (n = 2).

