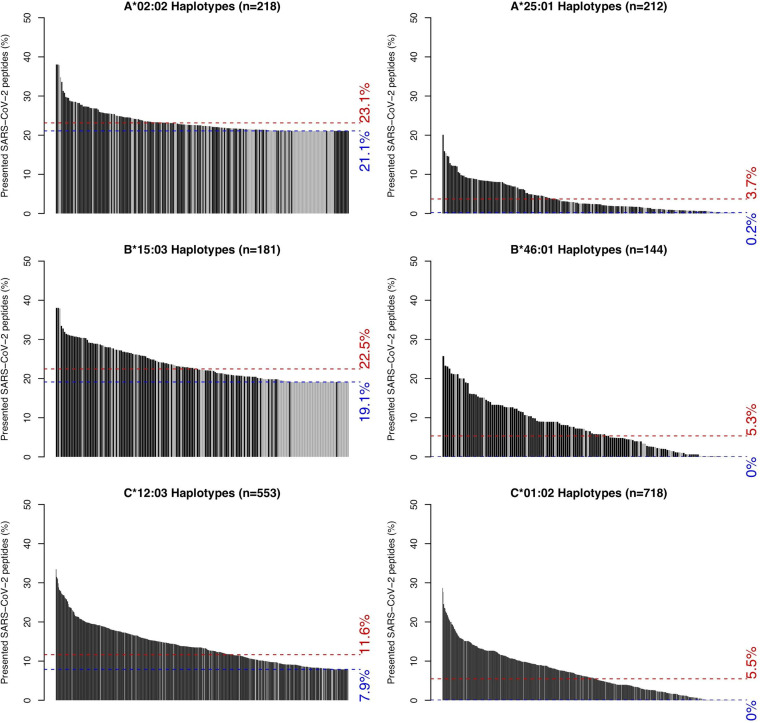
FIG 6.
Distributions of SARS-CoV-2 peptide presentation across HLA haplotypes. The leftmost panels show the distributions of SARS-CoV-2 peptide presentation capacity for haplotypes containing one of three representative HLA alleles (HLA-A*02:02, HLA-B*15:03, and HLA-C*12:03) with the greatest predicted repertoire of epitopes from the SARS-CoV-2 proteome. The rightmost panels show the distributions of SARS-CoV-2 peptide presentation capacity for haplotypes containing one of three representative alleles (HLA-A*25:01, HLA-B*46:01, and HLA-C*01:02) with the lowest predicted levels of epitope presentation from the SARS-CoV-2 proteome. Black and gray bars represent full and partial haplotypes, respectively. Blue and red dashed lines represent the percentages of presented SARS-CoV-2 peptides for the indicated allele itself (blue) and its global population frequency weighted average presentation across its observed haplotypes (red).

