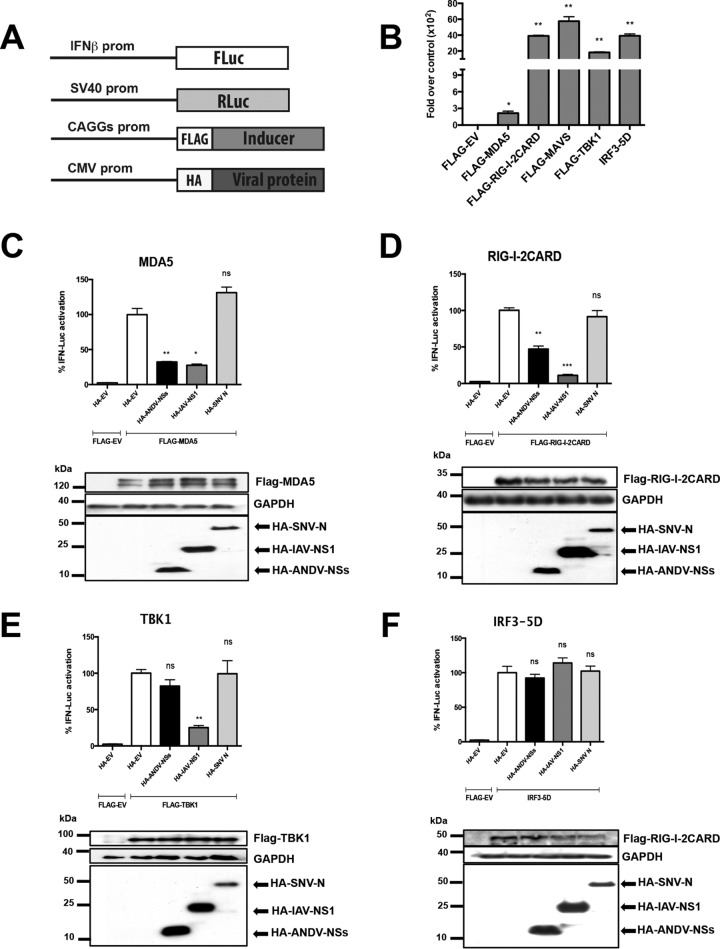
FIG 4.
The ANDV-NSs protein suppresses the IFN induction pathway downstream of MDA5 and RIG-I and upstream of TBK1. (A) Schematic representation of IFN-β–Fluc, SV40-Rluc, pHA-EV, pCAGGs-FLAG-EV, or pCAGGs-FLAG encoding the FLAG versions of MDA5, RIG-I-2CARD, MAVS, TBK1, or IRF3-5D plasmids used in the assays. (B) HEK-293T cells were transfected with IFN-β–Fluc, SV40-Rluc, pHA-EV, pCAGGs-FLAG-EV, or pCAGGs-FLAG encoding the FLAG versions of MDA5, RIG-I-2CARD, MAVS, TBK1, or IRF3-5D, all inducers of the IFN induction pathway by polyethyleneimine (PEI). At 18 h p.t., the cells were lysed, and FLuc and RLuc luciferase activities were determined using a commercial dual-luciferase assay (Promega). Values represent the relative luciferase activity (FLuc/RLuc) obtained for the IFN-β–FLuc reporter plasmids when transfected with the inducer plasmids over the FLuc/RLuc activity obtained when transfecting the FLAG-EV plasmid, which was arbitrary set as 1.Values shown are the mean (±SEM) of at least three independent experiments, each conducted in triplicate. Statistical analysis was performed with a Student’s t test (*, P < 0.05). HEK 293T cells were transfected with plasmids expressing the HA-tagged ANDV-NSs, IAV-NS1, and SNV-N proteins or with HA-EV along with plasmids expressing the FLAG-tagged version of MDA5 (C) RIG-I (D), TBK1 (E), or IRF-5D (F) and the plasmids IFN-β–FLuc and SV40-RLuc. At 18 h p.t., the cells were lysed with passive lysis buffer (Promega), and FLuc and RLuc activities were determined using a dual-luciferase assay (Promega). The relative luciferase activity (FLuc/RLuc) obtained for IFN-β–FLuc when transfected with the plasmid pHA-EV together with the inducer of the IFN production pathway was set to 100%. The values shown are the mean (±SEM) of at least three independent experiments, each conducted in triplicate. Statistical analysis was performed by ANOVA followed by Dunnett’s multiple-comparison test (*, P < 0.05). A representative Western blot for each set of experiments is shown below its corresponding bar chart.

