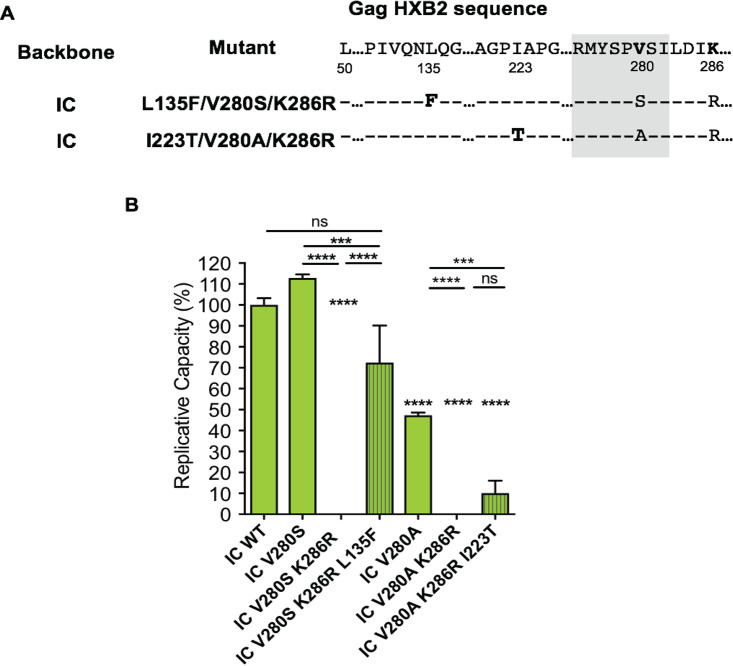
FIG 5.
Identification and VRC of the developed variants during viral inoculation. (A) Positions of the developed variants in Gag HXB2. (B) VRC of L135F/V280S/K286R and I223T/V280A/K286R variants in IC. All bars are shown as means with standard deviations. Striped bars represent developed mutants. One-way ANOVA multiple comparison and Dunnett’s correction were used for calculating P values. Asterisks indicate P values for results with the mutants compared to those with the wild type. (ns, not significant [P ≥ 0.05]; ***, P < 0.001; ****, P < 0.0001).

