FIG 5.
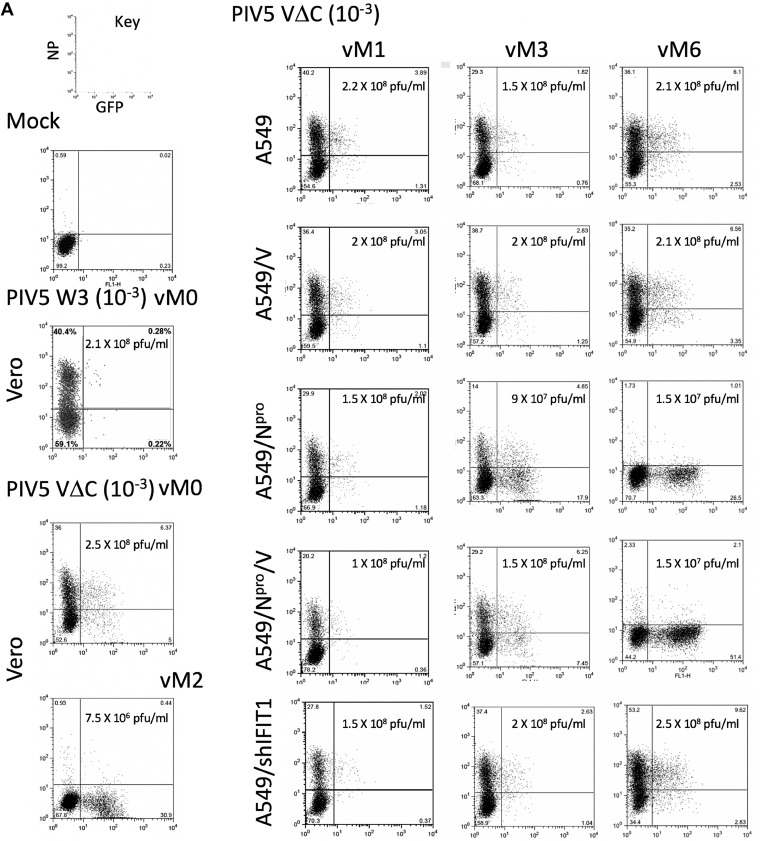
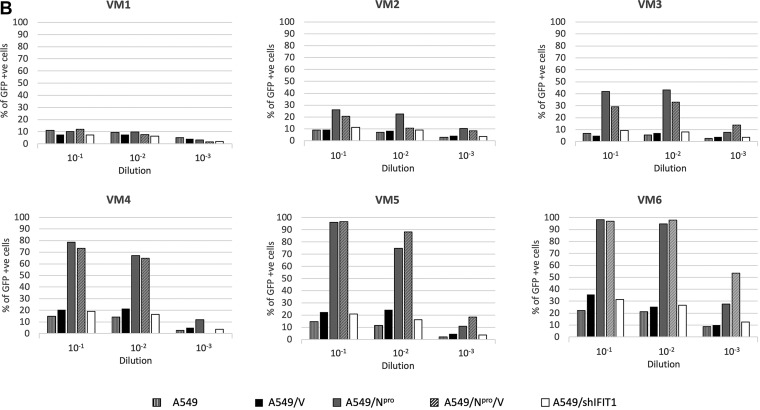
GFP induction in A549/pr(IFN-β)GFP cells following infection with vM1 to vM6 of PIV5-VΔC grown in A549 and derived cell lines. A549/pr(IFN-β)GFP reporter cells were mock infected or infected for 18 h with 10−3 dilutions of a DVG-poor stock of PIV5 (wt), vM0 or vM2 stocks of PIV5VΔC prepared in Vero cells, or with a 10−1, 10−2 or 10−3 dilution of the vM1 to vM6 stocks of PIV5VΔC prepared in A549, A549/V, A549/Npro, A549/Npro/V, or A549/shIFIT1 cells. At 18 h p.i., the cells were trypsinized, fixed, and stained for NP (PE stained). The relative intensity of GFP and PE staining in 10,000 cells was determined by flow cytometry on a Becton, Dickinson FACSCaliber flow cytometer machine. GFP intensity is measured on the x-axis, NP-PE on the y-axis. (A) Representative plotted graphs of the relative NP and GFP intensity for A549/pr(IFN-β)GFP cells infected with 10−1 dilutions of DVG-poor stock of PIV5 (wt), vM0, and vM2 stocks of PIV5VΔC, and a 10−1 dilution of the vM1, vM3, and vM6 stocks of PIV5VΔC prepared in A549, A549/V, A549/Npro, A549/Npro/V, or A549/shIFIT1 cells. Virus titers in these stocks are also shown. (B) The percentage of GFP +ve cells in A549/pr(IFN-β)GFP cells (as determined in panel A) infected with 10−1, 10−2, and 10−3 dilutions of the vM1 to vM6 PIV5VΔC stocks prepared in A549, A549/V, A549/Npro, A549/Npro/V, or A549/shIFIT1 cells.


