FIG 1.
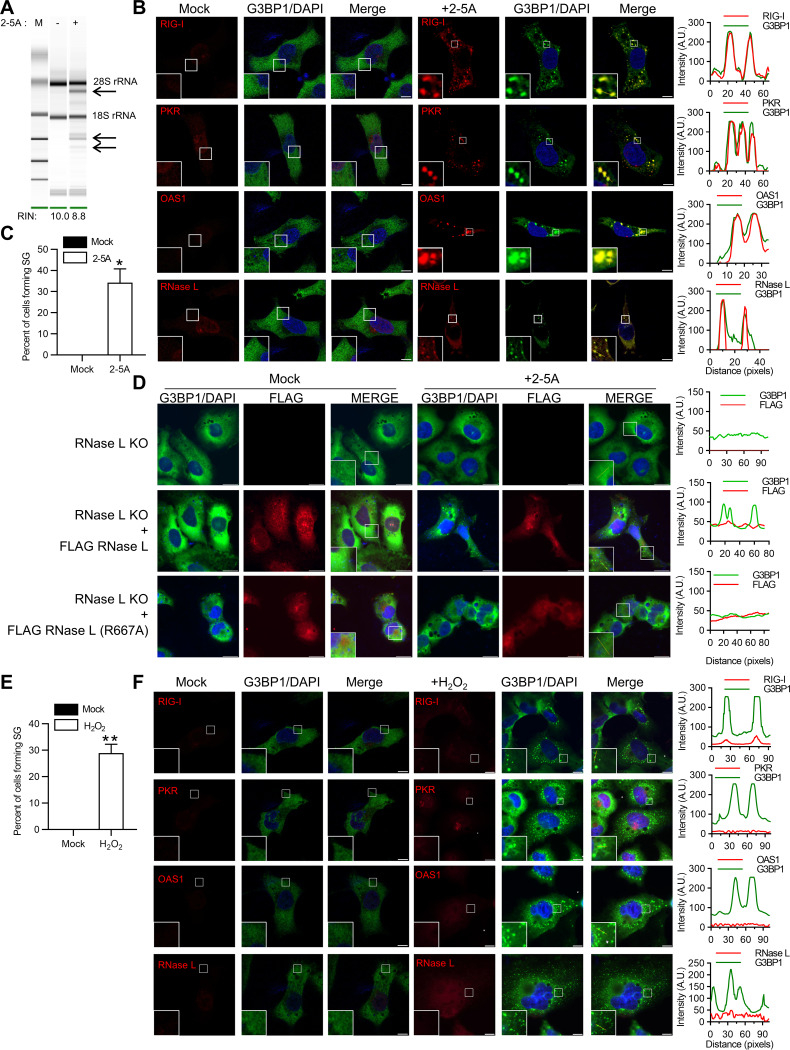
Activation of RNase L induces antiviral stress granule formation. (A) HT1080 cells were transfected with 2-5A (10 μM) for 8 h, and RNase L-mediated cleavage of rRNA (arrows) was analyzed on RNA chips using the Agilent Bioanalyzer 2100; RIN, RNA integrity number. (B) Cells were fixed and stained with G3BP1 and the indicated antiviral proteins. The magnified images correspond to the boxed regions. (Right) Intensity profiles of G3BP1 and antiviral proteins along the plotted lines, as analyzed by Image J line scan analysis. (C) The percentages of cells forming stress granules were quantitated. (D) RNase L KO cells were either mock transfected or transfected with FLAG-WT-RNase L or FLAG-R667A-RNase L and immunostained for G3BP1 and FLAG. (Right) Intensity profiles of G3BP1 and FLAG along the plotted lines as analyzed by Image J line scan analysis. (E) HT1080 cells were treated with H2O2 (1 mM) for 3 h, and the percentages of cells forming stress granules were quantitated. (F) The cells were immunostained with G3BP1 and the indicated antiviral proteins. (Right) Intensity profiles of G3BP1 and antiviral proteins along the plotted lines as analyzed by Image J line scan analysis. All the experiments included at least 100 cells from three replicates. Scale bars, 10 μm. The data are representative of at least three independent experiments. *, P < 0.01; **, P < 0.001. A.U., arbitrary units.

