Figure 3.
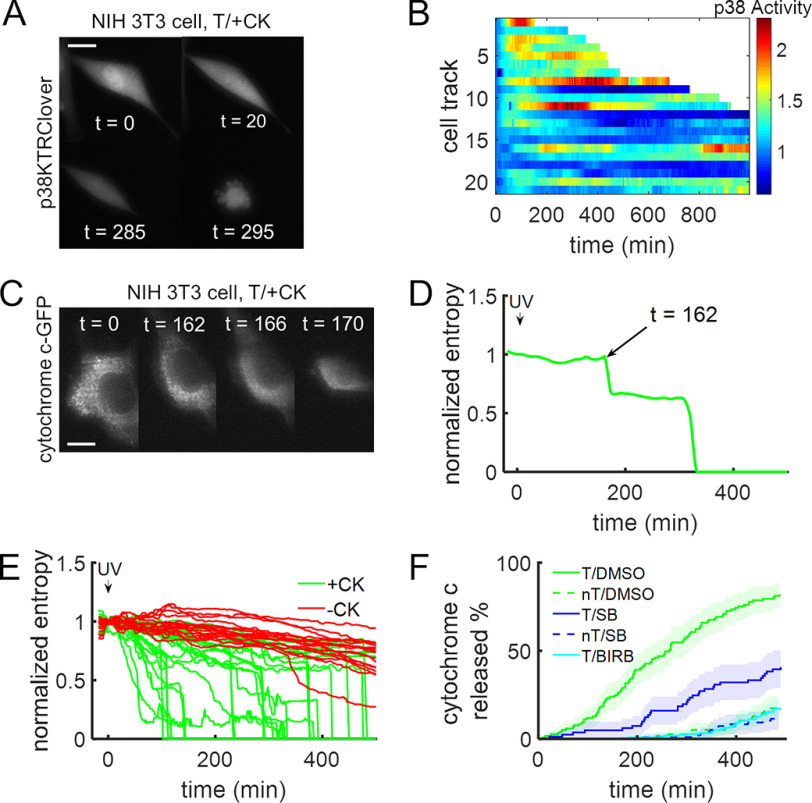
Decaging active MKK6 triggers cellular apoptosis. A and B, NIH 3T3 cells expressing the p38 activity reporter along with caged MKK6 were briefly irradiated with UV light (365 nm, ∼2s), and p38 activity was monitored for an extended period, leading to cell death. A, time-course montage of a representative cell. Scale bar, 10 μm; times are in minutes. B, heatmap of p38 activity over time in individual cells following light activation of MKK6. Truncated cell tracks indicate when cells showed catastrophic shrinkage. C, time-course montage of a representative NIH 3T3 cell stably expressing cytochrome c-GFP. Cytochrome c is released from mitochondria following decaging of constitutively active MKK6. Scale bar, 10 μm; times are in minutes. D, determination of the timing of cytochrome c release for the cell in C, quantified as the first abrupt drop in entropy, a measure of image texture. E, NIH 3T3 cells stably expressing cytochrome c-GFP were transfected with plasmids to express caged MKK6 and grown in the presence or absence of 2 mm CK. MKK6 was activated by brief UV irradiation (365 nm, <2 s). F, percentage of cells having released cytochrome c as a function of time following brief UV exposure. Cells were transiently transfected (T, solid lines) or not transfected (nT, dashed lines) with plasmids to express caged MKK6 and then preincubated with DMSO control (green; n = 117 and n = 115), SB 239063 (10 μm; blue; n = 74 and n = 92), or BIRB 796 (10 μm; cyan; n = 105) before UV exposure. The shaded regions represent 95% confidence intervals. All analyses include data replicated in three independent experiments.

