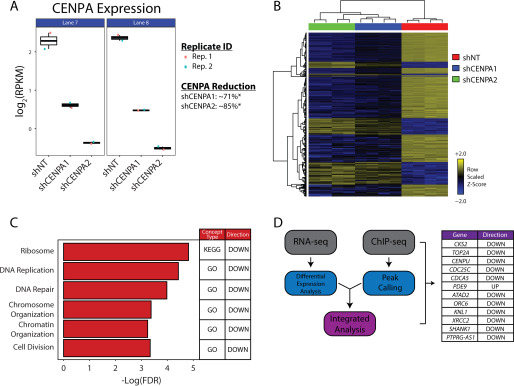
Figure 5.
Transcriptional profile of CENPA-depleted prostate cancer cells. A, Jitterplot reflecting CENPA knockdown efficacy across all replicates (Rep.). CENPA mRNA levels are depicted as a logarithmic representation of reads per kilobase per million (RPKM) from all replicates. B, heat map representation of the 427 DEGs compared with a nontargeting shRNA to two independent CENPA-targeted shRNAs. Unsupervised hierarchical clustering was performed to group samples (columns) and genes (rows) by similarities in data structure. C, ontologic assessments conducted on the 427 DEGs using the RNAEnrich program. A subset of significant concepts from the analysis of CENPA-depleted cells are depicted. The Kyoto Encyclopedia of Genes and Genomes (KEGG) and Gene Ontology (GO) are databases that reflect ontologies representative of connected biological processes. D, transcriptional profile of CENPA-depleted 22Rv1 cells merged with CENPA ChIP-seq data from VCaP. The genes listed demonstrate both differential expression with CENPA depletion, as well as CENPA binding. The directionality of differential expression for each gene is depicted in the right column. Only genes that satisfy the absolute log fold change > 2, and FDR < 0.05 were considered for integrative analysis.

