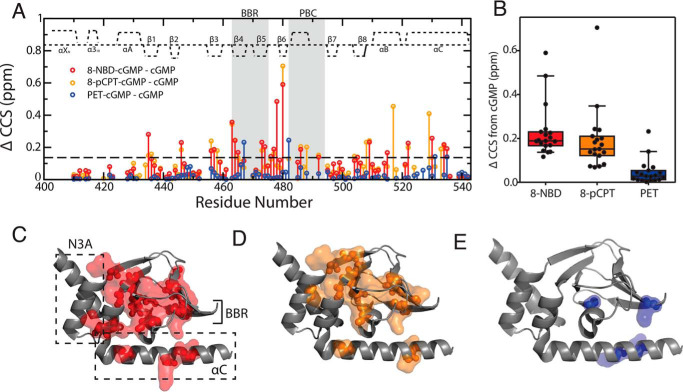
Figure 3.
cGMP analog versus cGMP chemical shift differences report on inhibitory conformational changes of PfD. A, ΔCCS between cGMP and 8-pCPT-cGMP (orange), 8-NBD-cGMP (red), and PET-cGMP (blue) bound PfD plotted against residue numbers. Dashed line, average ΔCCS + 2 S.D. of PET-cGMP. B, box plot (10–90% percentile) of ΔCCS differences between cGMP-bound and the 8-NBD-cGMP–, 8-pCPT-cGMP–, and PET-cGMP–bound samples. Residues included in the box plot correspond to residues that are assigned in all samples and with at least one of the three ΔCCS > average + 2 S.D. of PET-cGMP (dashed line in A). C–E, residues with CCS changes greater than the dashed line in A mapped onto the active structure of PfD for the 8-NBD-cGMP (C), 8-pCPT-cGMP (D), and PET-cGMP (E) bound samples. Error bars, S.D.

