Figure 6.
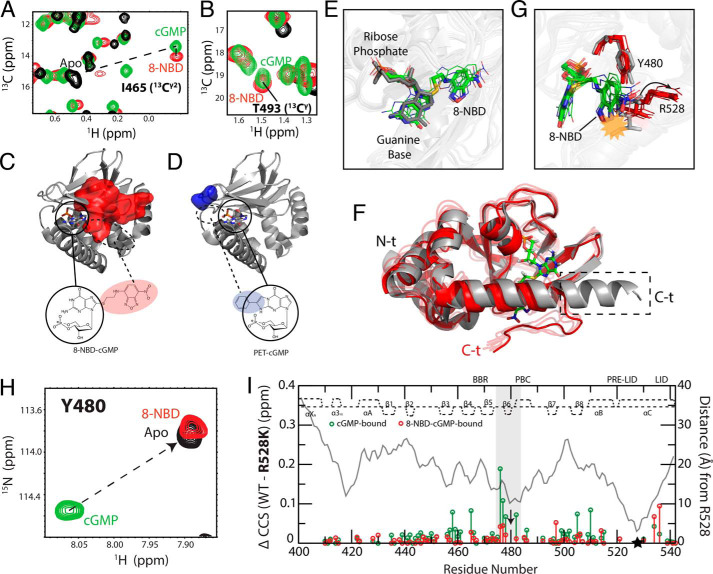
Syn conformation of 8-NBD-cGMP bound to PfD and effect of 8-NBD on the Tyr480–Arg528 interaction. A and B, overlaid 13C-1H HSQC spectral expansions of apo (black), cGMP-bound (green), and 8-NBD-cGMP–bound (red) PfD, zoomed into Ile465 (13C2) (A) and Thr493 (13CY) (B), which interact with the guanine base of cGMP. The apo peak for Thr493 (13CY) could not be assigned. C and D, map of residues in the β-barrel that exhibit ΔCCS relative to cGMP-bound PfD greater than the average ΔCCS + 2 S.D. of the PET-cGMP versus cGMP ΔCCS for the 8-NBD-cGMP-bound (C) and PET-cGMP–bound (D) PfD. Circles indicate the cGMP portion of the analog in its syn orientation (PDB code 4OFG). The dashed circles represent the region where the base substituents (i.e. 8-NBD or PET) are expected to be located when the cGMP portion of the analogs is in the syn orientation. E, overlay of the structure of cGMP:PfD (PDB code 4OFG) and representative structures of 8-NBD-cGMP:PfD generated from MD simulations (Table S2). The cGMP (dark gray) aligns with the cGMP portion of the 8-NBD-cGMP (green, carbon; white, hydrogen; blue, nitrogen; red, oxygen; yellow, sulfur; orange, phosphorus). F, aligned representative structures of 4OFG (gray) and 8-NBD-cGMP:PfD (red) generated from MD simulations. The dashed box indicates the portion of the C-terminal αC helix that becomes disordered in the 8-NBD-cGMP:PfD intermediate. G, similar to F, but zoomed into the Tyr480–Arg528 region. The yellow starburst indicates the steric clash of 8-NBD moiety with the Arg528 side chain in the 4OFG structure. The arrow indicates the structural shift of the Arg528 side chain upon binding of 8-NBD-cGMP. H, 1H-15N HSQC spectra of apo (black), cGMP-bound (green), and 8-NBD-cGMP-bound (red) samples overlaid and zoomed in on Tyr480. I, WT versus R528K CCS differences for cGMP-bound (green) and 8-NBD-cGMP–bound (red) samples. Residues assigned in both the cGMP-bound and the 8-NBD-cGMP–bound samples are plotted. The distance (Å) measured from Arg528 using the cGMP-bound structure (PDB code 4OFG) is shown in a gray line. The secondary structure of cGMP-bound PfD is depicted at the top of each plot. The highlighted region indicates residues near Tyr480, where the perturbation induced by the R528K mutation in the cGMP-bound complex is lost when cGMP is replaced by 8-NBD-cGMP. Black arrow, Tyr480; black star, Arg528.

