Figure 3.
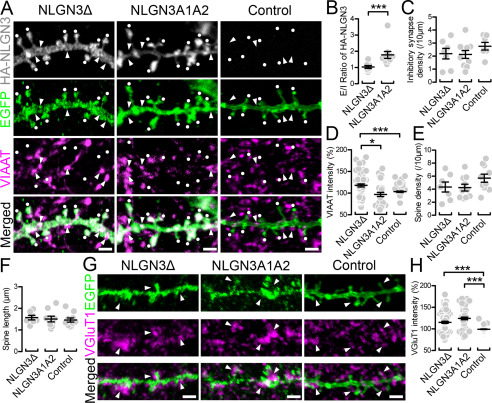
Synaptic targeting of NLGN3 splice isoforms in CA1 pyramidal neurons. A, maximum projection images of dendritic segments labeled for HA-NLGN3 (gray), EGFP (green), and VIAAT (magenta) in CA1 pyramidal cells overexpressing HA-NLGN3Δ (left), A1A2 (middle), and EGFP control (right). White dots and arrows indicate EGFP+ spines and VIAAT+ inhibitory synapses, respectively. Scale bars, 2 μm. B–F, summary scatter plot showing the E/I ratio of HA signals (B), inhibitory synapse density (C), VIAAT intensity (D), spine density (E), and spine length (F) for individual dendritic segments of CA1 pyramidal cells overexpressing HA-NLGN3Δ (left, n = 7 dendrites), A1A2 (middle, n = 10), and control (right, n = 10). VIAAT intensity is normalized to the averaged VIAAT intensity in neighboring inhibitory terminals on the same image. G, maximum projection images of dendritic segments labeled for EGFP (green) and VGluT1 (magenta) in CA1 pyramidal cells overexpressing HA-NLGN3Δ (left), A1A2 (middle), and control (right). Arrowheads indicate VGluT1-labeled terminals contacting transfected dendrites. H, summary scatter plot showing VGluT1 intensity for individual dendritic segments of CA1 pyramidal cells overexpressing HA-NLGN3Δ (left, n = 7 dendrites), A1A2 (middle, n = 6), and control (left, n = 7). VGluT1 intensity is normalized to the averaged VGluT1 intensity in neighboring excitatory terminals on the same image. Scale bars, 2 μm. *, p < 0.05; ***, p < 0.001 (one-way analysis of variance followed by Sidak's multiple-comparison test or U test). Error bars, S.E.M.

