Figure 4.
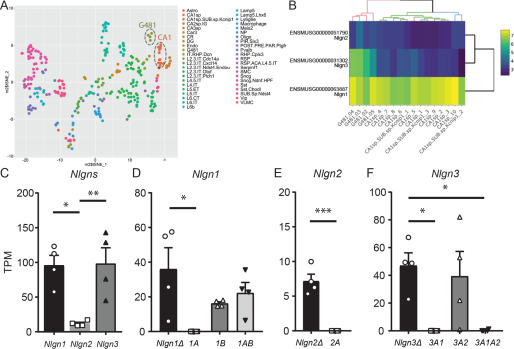
Endogenous Nlgn expression in hippocampal CA1 pyramidal neurons. A, single-cell t-SNE plot of four single-cells (G481.O2, .03, .04, and.05) and Allen Brain Atlas single cells. B, heat map of Nlgn gene expression in hippocampal CA1 primary neurons. A hierarchical clustering demonstrated a segregation of G481 cells from adult CA1 pyramidal neurons for Nlgn3, potentially due to relatively higher expression of Nlgn3 in G481 cells. Scale bar, log2 + 1–transformed TPM values. C, summary bar graph of Nlgn gene (Nlgn1, 2, and 3) expression. D–F, summary graphs of splice isoforms of Nlgn1 (D), 2 (E), and 3 (F). *, p < 0.05, one-way analysis of variance followed by Sidak's multiple-comparison test or U test, n = 4. Error bars, S.E.M.

