Figure 1.
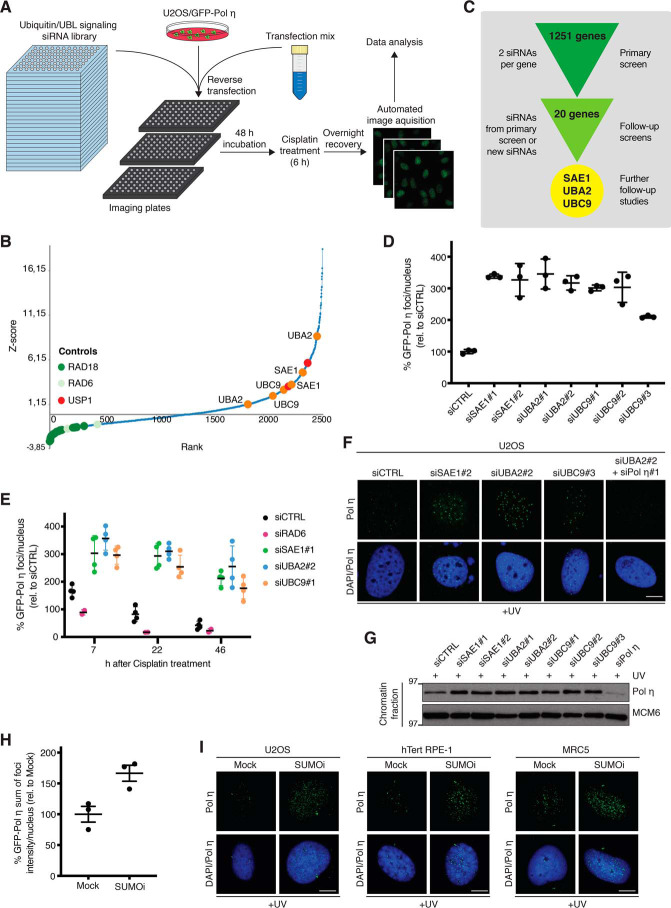
A microscopy-based screen reveals SUMO-dependent regulation of Pol η association with DNA damage sites. A, experimental set-up of high-throughput microscopy-based screen for ubiquitin and UBL signaling network components regulating Pol η interaction with sites of cisplatin-induced DNA damage. See text for details. B, results of the screen outlined in A. Scatter plot shows ranked Z-scores of cisplatin-induced GFP-Pol η foci counts of all siRNAs in the library (2 siRNAs per gene), determined by QIBC analysis. Controls (RAD18-RAD6 and USP1) are indicated in green and red, respectively. SUMO E1 (SAE1 and UBA2) and E2 (UBC9) enzymes are indicated in orange. See also Table S1. C, workflow of primary and validation screens, and hit selection. See also Table S2. D, results of the validation screen analyzing GFP-Pol η foci count in U2OS/GFP-Pol η cells transfected with the indicated siRNAs, exposed to cisplatin for 6 h, and fixed 16 h later and quantified using QIBC analysis (mean ± S.D.; n = 3 independent experiments; ≥294 cells quantified per condition). E, results of validation screen analyzing kinetics of GFP-Pol η foci formation in cells treated as in D (mean ± S.D.; n = 3 independent experiments; ≥3,000 cells quantified per condition). F, representative images of endogenous Pol η foci formation in U2OS cells transfected with the indicated siRNAs and exposed to UV. Scale bar, 10 μm. G, immunoblot analysis of chromatin-enriched fractions of U2OS cells treated as in F. H, U2OS/GFP-Pol η cells were preincubated or not with SUMOi for 30 min, exposed to UV (20 J/m2), and collected 6 h later. The sum of GFP-Pol η foci intensity per nucleus was quantified by QIBC (mean ± S.E.M.; n = 3 independent experiments; ≥7,482 cells quantified per condition). I, representative images of endogenous Pol η foci formation in U2OS, hTert RPE-1, and MRC5 cells treated as in H. Scale bar, 10 μm.

