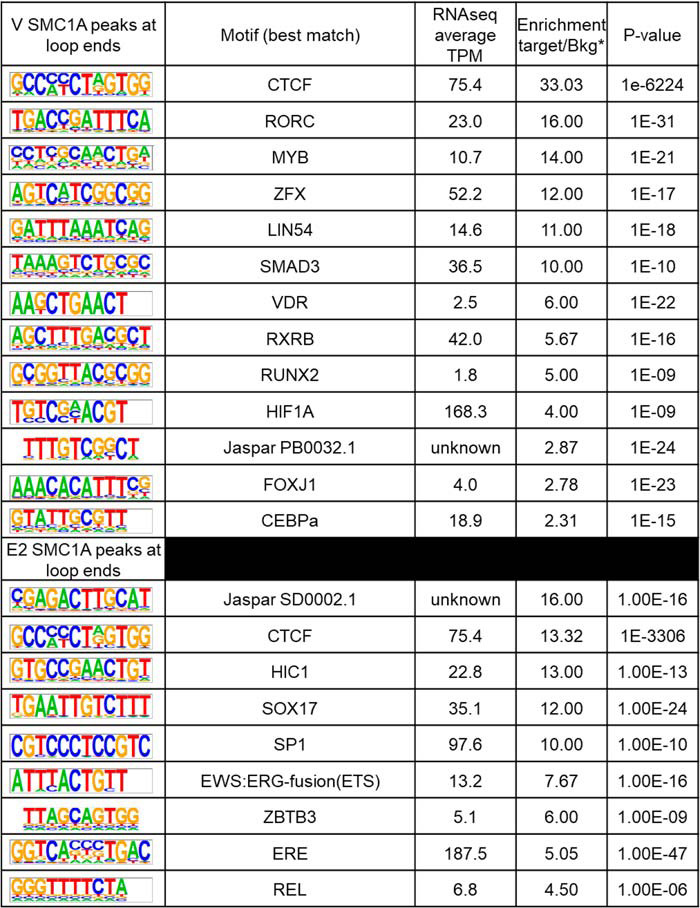
Table 1.
HOMER analysis showing de novo motifs in SMC1a peaks that overlap with anchors of loops with SMC1a at both ends (Fig. 3B) in V-treated (top) or E2-treated (bottom) samples
Shown is the average TPM (average of V, E2 2-h, and E2 6-h transcripts per million) of transcription factors that bind to motifs. *, ratio of the percentage of target with motif to the percentage of background with motif.