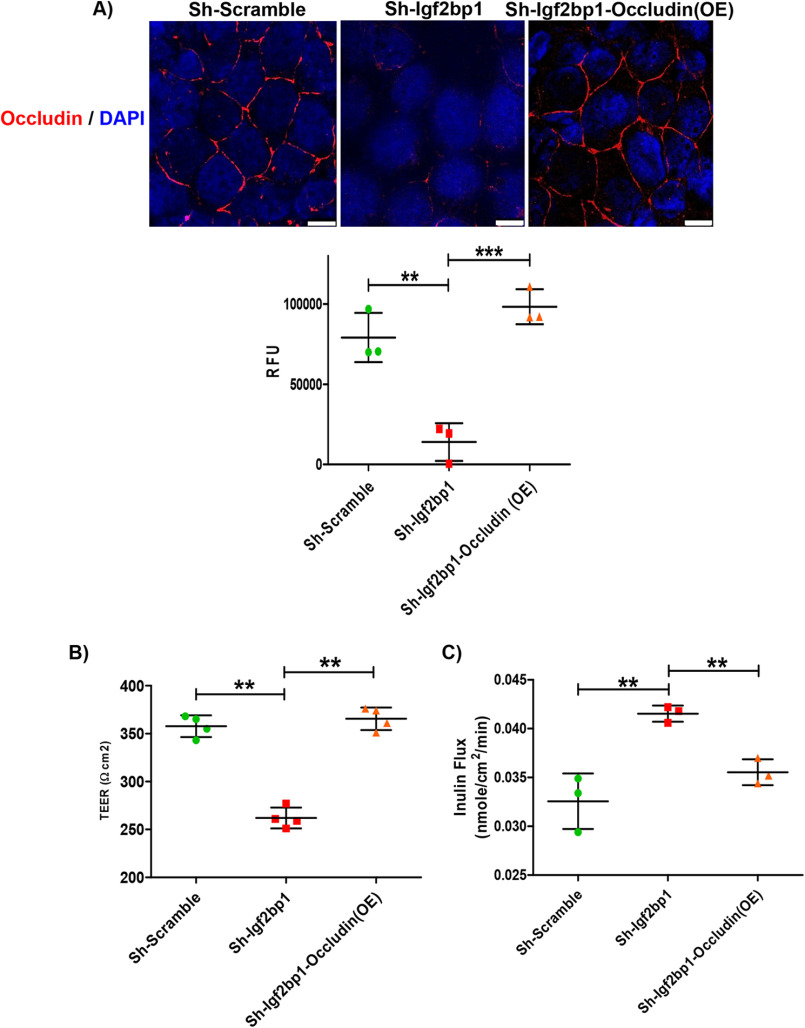
Figure 5.
Restoration of barrier function upon re-expression of occludin. A, monolayer of Caco-2 cells, transduced as indicated, were stained with occludin (red) antibody. Five images, each from a different area of the same plate, were captured and quantified using ImageJ software. The data shown below the images represent three biological replicates. Scale bar, 10 μm. B, determination of paracellular permeability by TER. The TER was measured after growing Caco-2 cells transduced as indicated for 15 days in chambered plates. The data are mean ± S.D. (n = 3) with p = 0.0030 and p = 0.0024, respectively. C, the apical flux of the paracellular macromolecular probe, inulin (molecular radius, 15 Å) was measured and plotted for filter-grown Caco-2 cells transduced as indicated. **, p < 0.01; ***, p < 0.001; RFU, relative fluorescence units.

