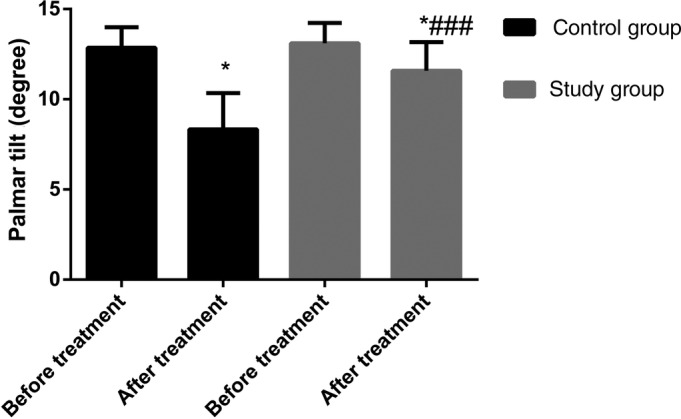
Figure 3.

Palmar tilt in the two groups before and after treatment. Before treatment, there were no intergroup differences; after treatment, both groups experienced some level of decreases, while the magnitude of decreases in the control group were greater. *P < 0.05 vs the same group before treatment. ### P < 0.05 vs the control group during the same period of time.
