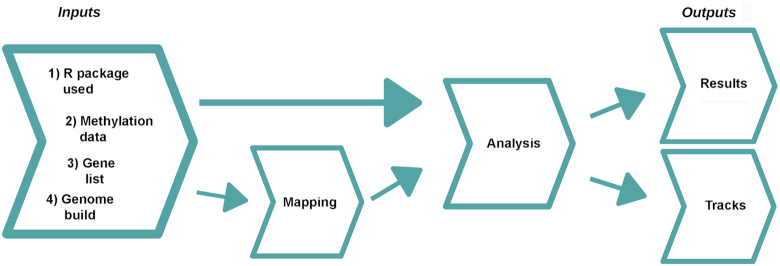
Figure 1:
Overview of CandiMeth workflow. When the CandiMeth workflow is started the user needs to specify as Inputs (left): (i) the type of R package used; (ii) the methylation data, normally in the form of a differential methylation table generated by the package; (iii) a list of genes to be analysed; and (iv) a human genome build to match the data to. The methylation data are then mapped (centre left) to the genome and sites overlapping features of interest analysed (centre right). The data are then output quantitatively as Results and visually as Tracks (right).

