Figure 6:
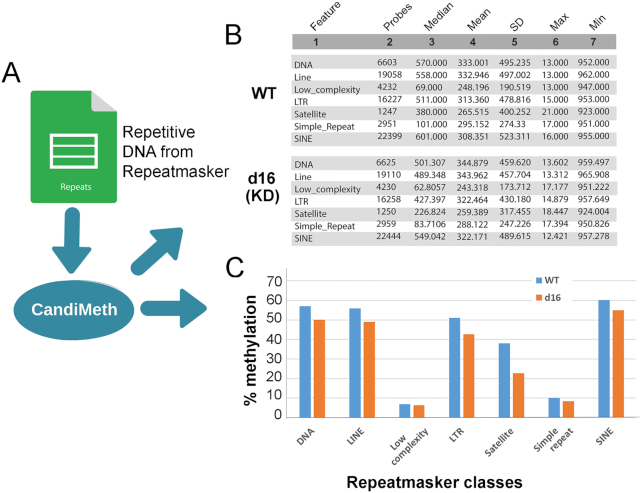
Case Study 3: Analysis of LINEs and SINEs. Use of CandiMeth to give an overview of methylation at repetitive elements. (A) Data on repeat location and type from the RepeatMasker track on UCSC has been parsed and made available through the workflow: users can therefore simply type in the name(s) of a class of repeats as a query. (B) Example outputs showing probe coverage of repeats on the EPIC array and methylation statistics for each repeat class in a DNMT1 knockdown cell line (d16 KD) versus WT. (C) Tables from B were exported, median methylation levels converted to percent, and then graphed to highlight differences between the 2 cell lines: decreases in methylation are seen at some (LINE, SINE, satellite) but not other repeats (low complexity, simple).

