Figure 2.

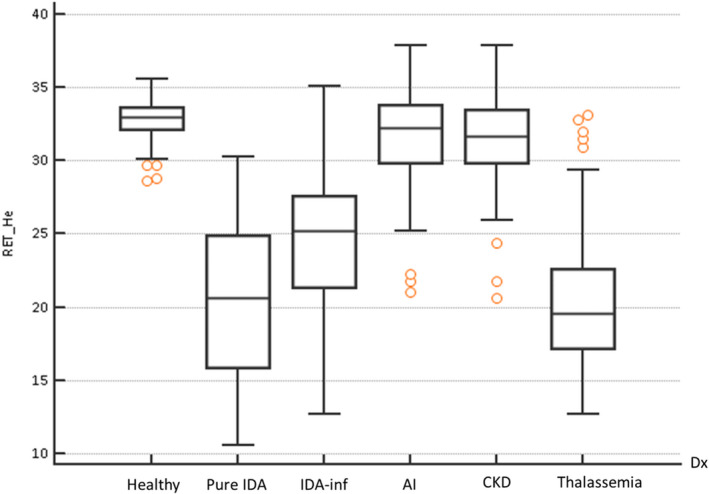
RET‐He values among the population groups. Box‐and‐Whisker plot illustrates RET‐He values among six population groups in this study. Comparison of values between groups is performed by the Kruskal‐Wallis test (P < .05)

RET‐He values among the population groups. Box‐and‐Whisker plot illustrates RET‐He values among six population groups in this study. Comparison of values between groups is performed by the Kruskal‐Wallis test (P < .05)