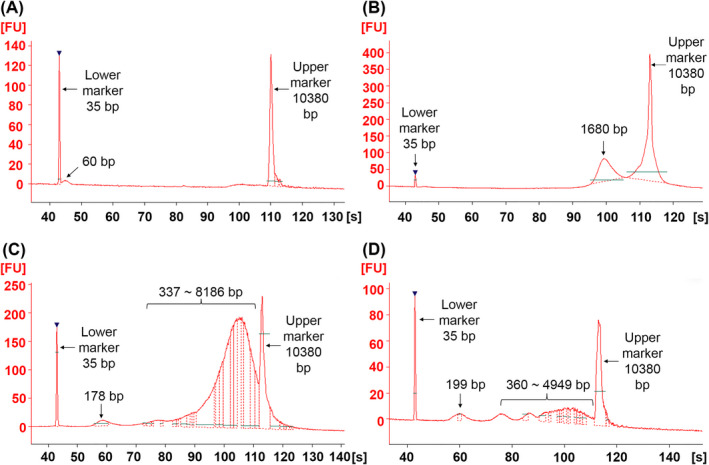
Figure 1.

Evaluation of cfDNA fragment length using Agilent 2100 Bioanalyzer. A‐D, Characterization results of raw CSF with fivefold dilution (A), raw serum with fivefold dilution (B), extracted CSF (C) and extracted serum (D) from patient 3. X‐axis represents the migration time of DNA fragments. Y‐axis indicates fluorescence intensity. The lower marker is 35 bp, and the upper marker is 10 380 bp. The numbers above peaks indicate the length of DNA fragments
