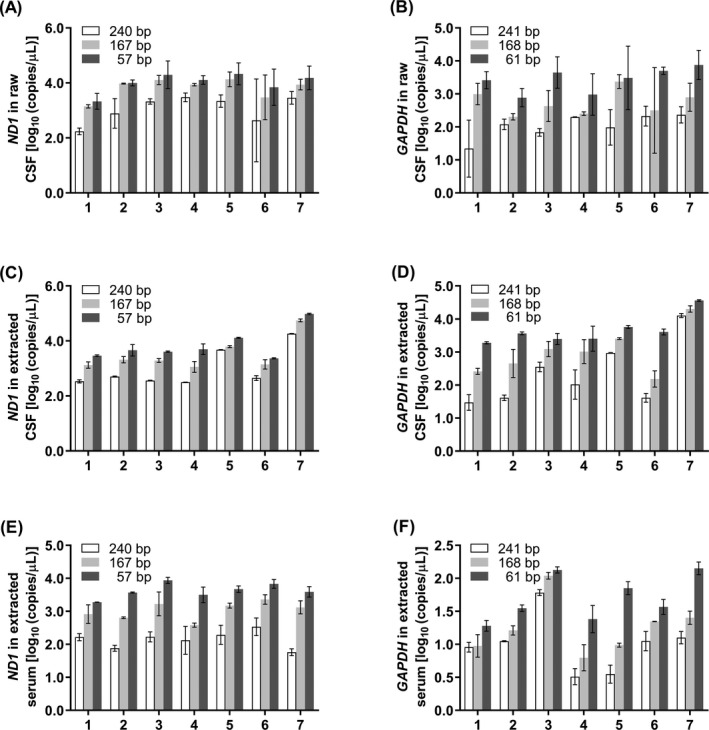
Figure 2.

Quantification of cfDNA copy number by qPCR. A, B, Raw CSF was amplified with primer pairs of ND1 (A) and GAPDH (B). C, D, Extracted CSF was amplified with primer pairs of ND1 (C) and GAPDH (D). E, F, Extracted serum was amplified with primer pairs of ND1 (E) and GAPDH (F). X‐axis represents patients, and Y‐axis represents log10 of copies/µL in initial raw samples. Data are presented as mean ± SD, n = 3
