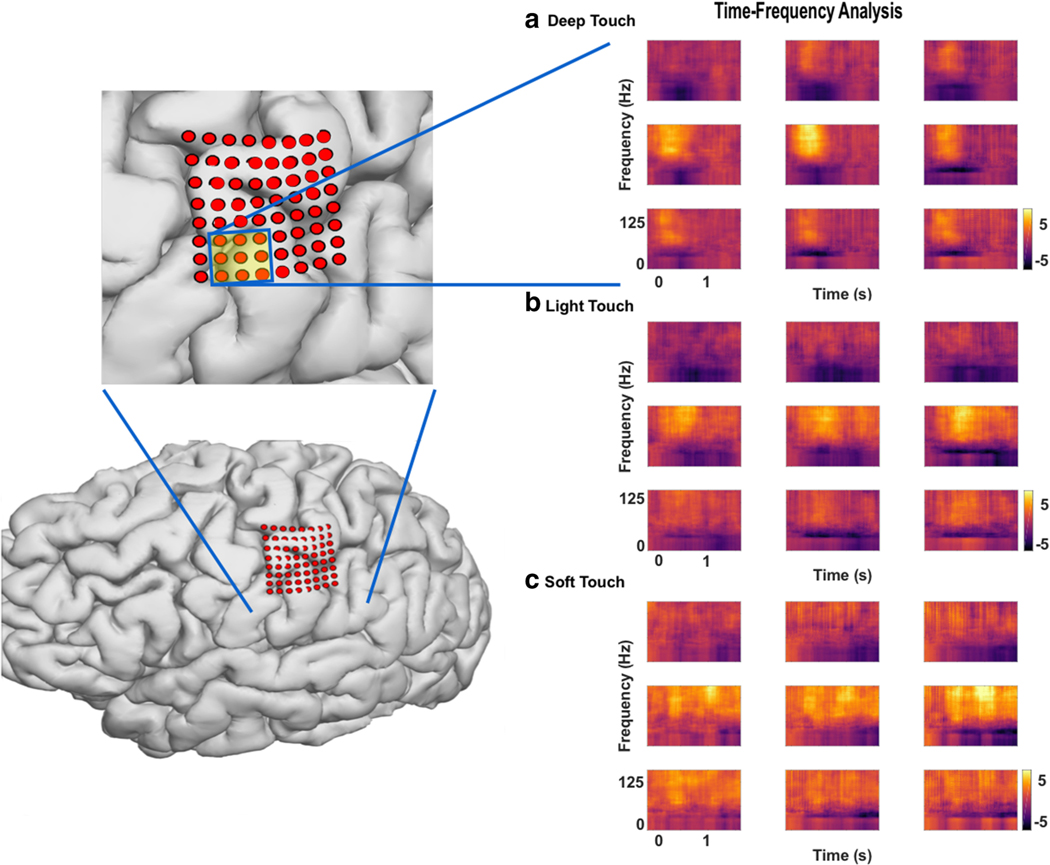
Fig. 5.
Time–frequency plots in neighboring channels in S01 during the three types of touch The grid location on the cortex, with an area zoomed in on the grid, highlighting the six electrodes displayed on the right. Elevations in HG activity, and decreases in alpha, beta, and gamma power, can be seen in several channels. During cortical mapping, the channels shown caused percepts in the digit used for testing. Although the area of the digit being tested was small, changes spread through the electrodes

