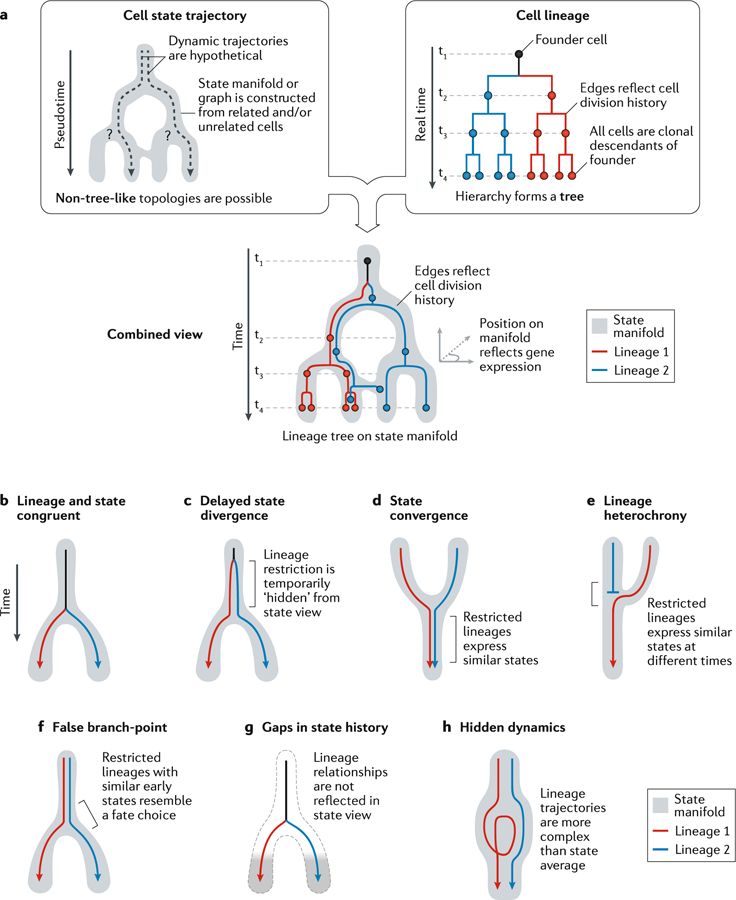
Fig. 2 |. Limitations of cell state manifolds.

a | Clarification of depictions of cell state manifolds versus cell lineage trees. Trajectory relationships are indirectly inferred from gene expression similarities, whereas lineage relationships reflect measured mitotic histories. Below the boxes, a combined representation highlights a clonal hierarchy of related cells, directly revealing its trajectory along astate manifold. b-h| Hypothetical scenarios of restricted lineage trajectories unfolding ona state manifold. The behaviours of distinct clonal units are presented in simplified form by coloured arrows. Lineage and state congruent (part b): initially all clones share the same fate potential (black); restriction of the clones into distinct trajectories (blue/red) occurs only where the manifold bifurcates. Delayed state divergence (part c): cells become committed to distinct trajectories (blue/red) but continue to occupy similar states for some time. This causes the early state to appear seemingly multipotent despite the cells within each clone being fate-restricted. State convergence (part d): cells with distinct molecular histories converge into similar states, such that the molecular origin of later cells can no longer be inferred. Lineage heterochrony (part e): cells with different origins occupy a sequence of states that implies a false developmental trajectory (blue to red). False branch-point (part f): an extreme case of the situation in part c, in which an apparent branch-point does not represent a decision made by any cell. Instead, it appears artificially when fate-restricted clones overlap in their early state. Gaps in state manifold (part g): disconnected cell states appear when the states of transitional and early progenitors are not represented in the dataset. This occurs when transitional states are very rare or when sampling a developing tissue at a late stage. Hidden dynamics (part h): the extent of stochastic or structured fluctuations in clonal dynamics is not visible from snapshots of cell states.
