
Fig. 5 |. Applications and pitfalls of lineage tracing on state manifolds.
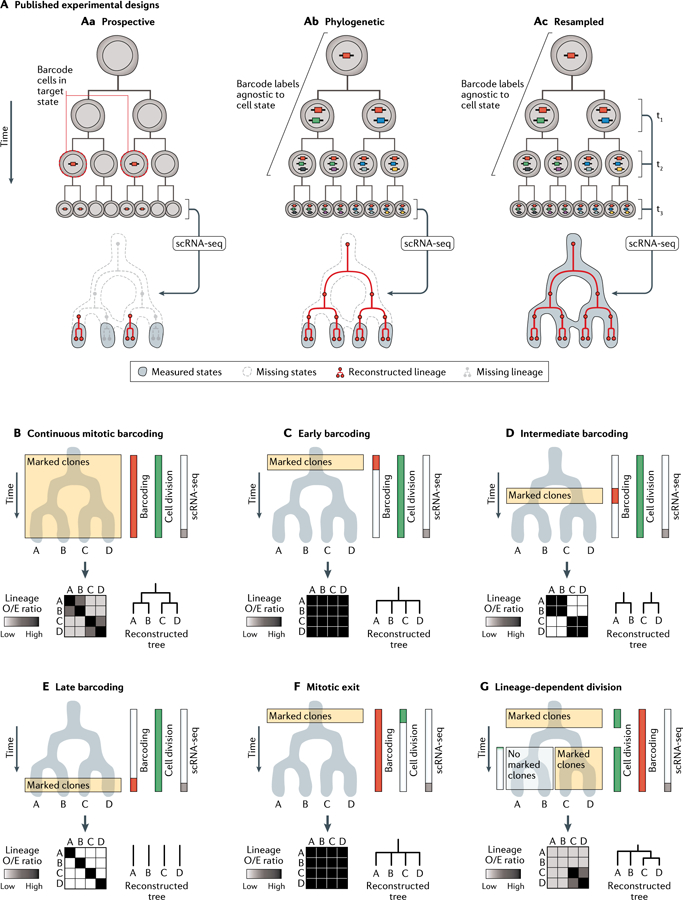
A | Recent studies have highlighted three experimental designs for combining lineage and state measurements. For simplicity, the panels depict largely congruent state-lineage hierarchies. Prospective (part Aa): a bulk genetic label is applied to cells of a particular state; labelled cells are subsequently captured and sequenced to reveal the gene expression states and lineage barcodes for each cell. Phylogenetic (part Ab): gene expression states and lineage barcodes are measured at a defined end point with respect to a biological process. Prior lineage relationships can be reconstructed retrospectively from the lineage barcodes, whereas state information is limited to the final time point. Resampled (part Ac): gene expression states and lineage barcodes are repeatedly sub-sampled over time, enabling the mapping of lineage trends directly on the state manifold. B-G | Phylogenetic reconstruction of fate hierarchies from end-point state and lineage measurements. The results of hypothetical lineage-state reconstruction analyses are displayed for each scenario; they vary dramatically, depending on the timing of both cell division and lineage barcoding. Heat maps depict the number of shared barcodes observed between each pair of states, normalized by the expected number of barcodes under a null hypothesis in which barcodes are distributed at random (‘Lineage 0/E ratio’). For a thorough definition of this statistic, see Weinreb et al. (2020)84. Lineage relationships can only be inferred at the time points when marked clones are generated and expanded. Given constant cell division rates and identical state manifolds, different time windows of barcode induction will lead to different inferences about lineage relationships. B | Continuous lineage barcoding in an actively dividing cell population enables all major lineage restriction events to be well-represented in a lineage-state reconstruction analysis. C-E | Lineage relationships can only be inferred at time points when marked clones are generated and expanded. Given constant cell division rates and identical state manifolds, different time windows of barcode induction will lead to distinct inferences about lineage-state relationships. F | In postmitotic differentiation hierarchies, despite continuous DNA barcoding, an absence of cell division precludes the formation of marked clones containing> 1 cell. Barcodes are no longer enriched across the state manifold and cannot be used to reconstruct fate restriction hierarchies. G | Lineage inferences require well-sampled barcode data from marked clones. Variable rates of cell division on a state manifold skew clone sizes and, hence, the statistical power to detect lineage-barcode correlations. scRNA-seq, single-cell RNA sequencing.