
Fig. 6 |. Developmental paradigms that shape state-lineage relationships.
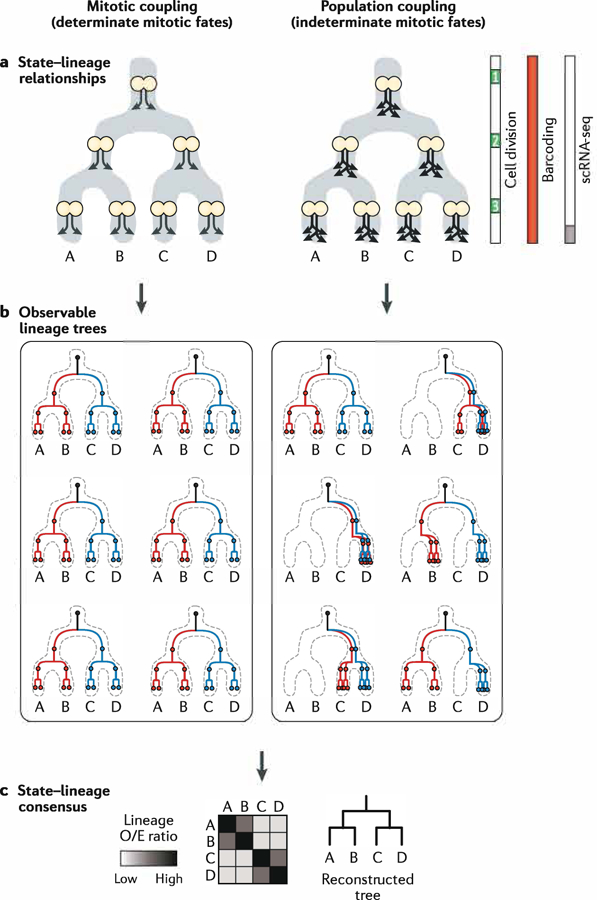
a | State manifold diagrams depicting the timing and fates of mitotic daughter cells. In cases of mitotic coupling (left), cells divide asymmetrically and give rise to distinct daughter states. In cases of population coupling (right), the average flux of cells down branches of the state manifold is maintained, but the fates of individual daughter cells are largely unpredictable. b | Examples of observable lineage trees that result from mitotic or population coupling. Mitotic coupling (left) leads to invariant, determinant lineage trees. Population coupling (right) permits a large number of observable lineage tree possibilities (six shown). c | Consensus relationships derived from a large number of individual tree observations. Despite the varied possibilities for the individual lineage trees in part b, the lineage relationships between states will be similar for both mitotic- and population-coupling scenarios. The heat map plots lineage observed/expected (0/E) ratios (see the FIG. 5 legend and Weinreb et al. (2020)84 for the definition). scRNA-seq, single-cell RNA sequencing.