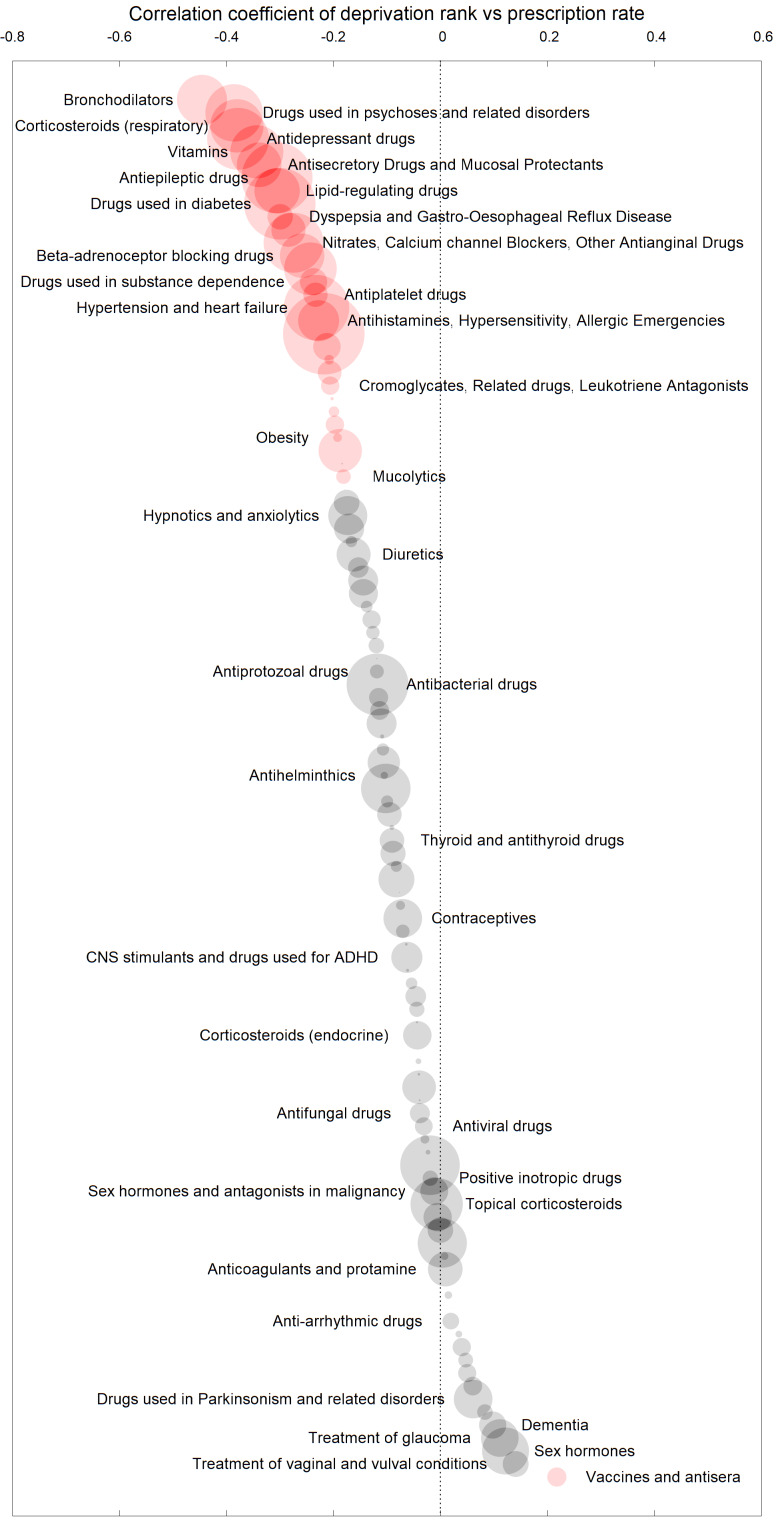
Figure 2.
Bubble plot to show the Kendall’s tau correlation coefficient of prescription rate of drug classes (grouped by British National Formulary section) with multiple deprivation index. More negative correlation coefficient indicates a greater degree of prescribing in areas with greater socioeconomic deprivation. Bubble area indicates the number of prescriptions of this class. Drug classes which differed significantly from zero (corrected p<0.0005) are highlighted in red. Key drug classes are labelled. ADHD, attention-deficit hyperactivity disorder; CNS, central nervous system.

