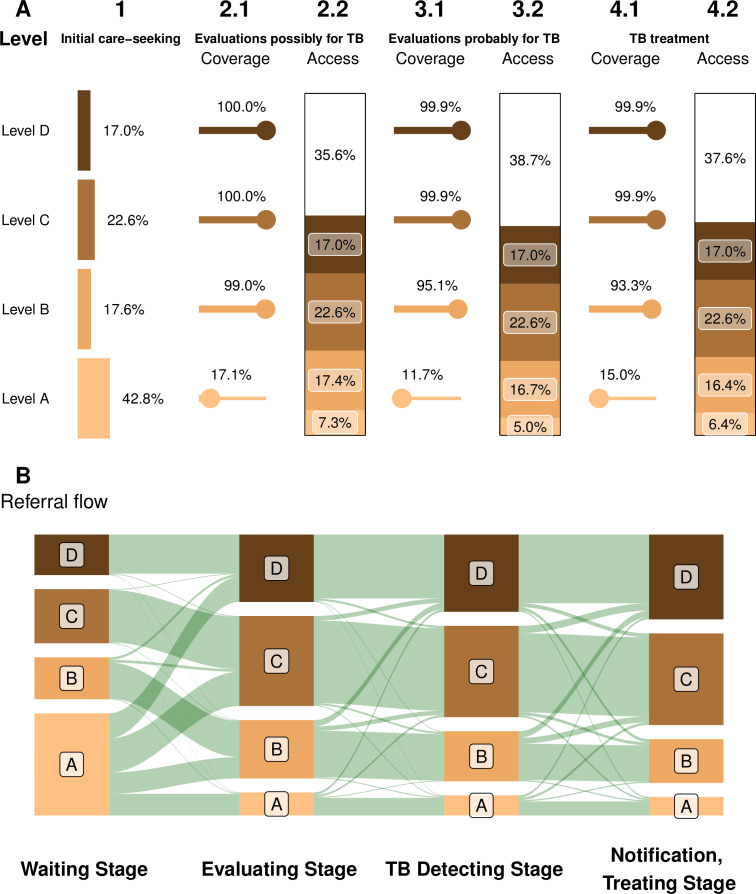
Figure 2.
Alignment between the capacity for TB diagnosis and treatment, and patients’ preferences in seeking care hospital levels: A, for primary care/general practice; B, for regional hospitals with inpatient capacity; C, for larger district hospitals; D, for large hospitals with a range of specialists. (A) Coverage of and access to TB services at different levels of Taiwan’s health system modified. This panel is a modified version of the visualisation introduced by Hanson et al.7 Coverage is the proportion of facilities at that level offering a service; access is the product of coverage and the fraction of patients seeking care at that level. (B) Patient flows between levels at each stage, including clinician referral and self-referral (vertical heights of bands are proportional to numbers). TB, tuberculosis.

