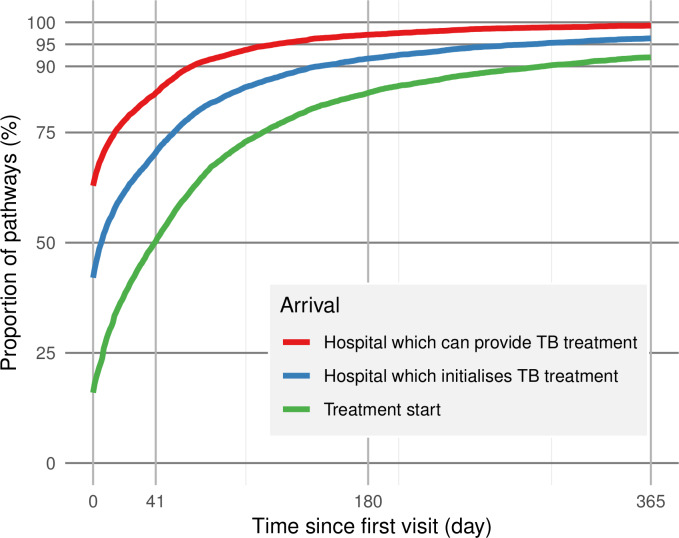
Figure 3.
Delays from initial care-seeking; the curves indicate the proportion of pathways by time that have reached hospitals providing TB treatment (red); reached the hospital, which ultimately initiates their TB treatment (blue); and started treatment (green). The vertical line on day 41 denotes the median system delay. TB, tuberculosis.

