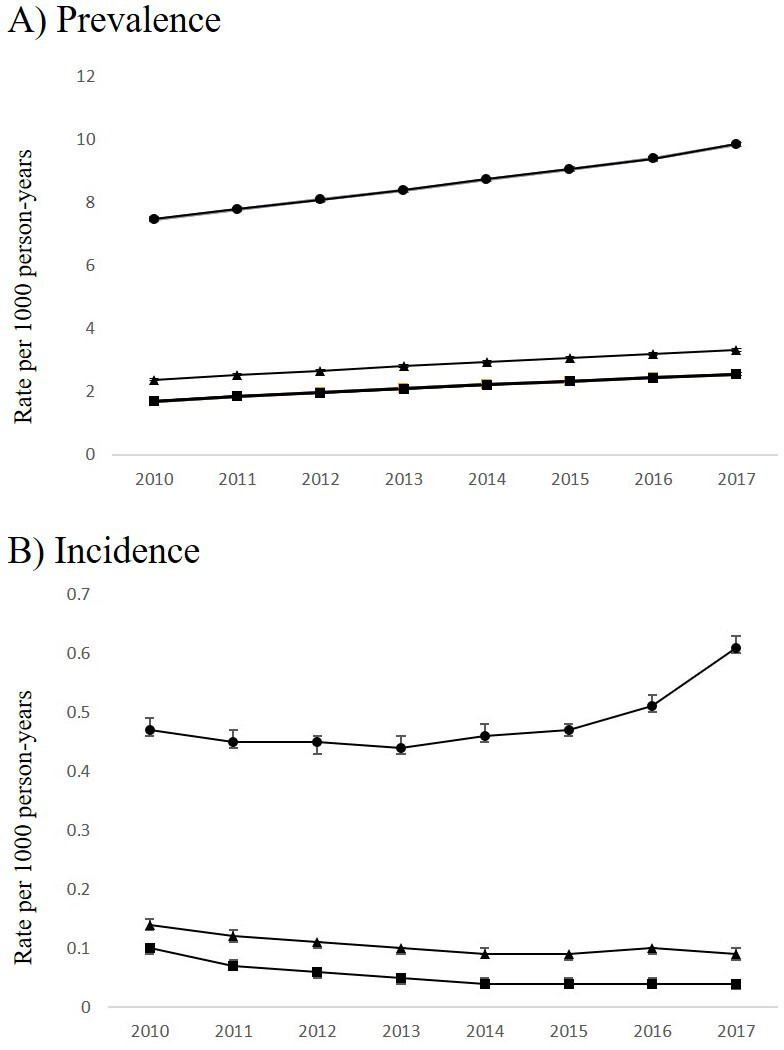
Figure 3.

Age-standardized and sex-standardized (A) prevalence and (B) incidence trends of T1D in Ontario, Canada per 1000 person-years*. Legend: closed circles: high sensitivity, low PPV algorithm (AdminRule 4); closed triangles: moderate sensitivity, moderate PPV algorithm (AdminRule 3); closed squares: low sensitivity, moderate PPV algorithm (AdminRule 2). *The denominator for determination of prevalence rates was person-years of follow-up for all eligible subjects in each fiscal year. The denominator for determination of incidence rates was person-years of follow-up for eligible subjects excluding those previously identified with T1D prior to the start of each fiscal year. PPV, positive predictive value; T1D, type 1 diabetes.
