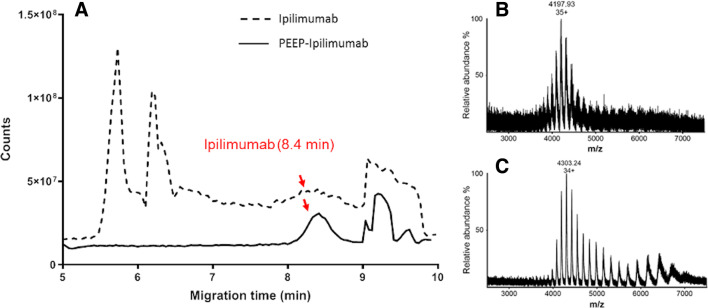
Figure 4.
Mass spectrum comparison between ipilimumab and ipilimumab released from Pickering emulsions using ethiodized oil and poly-lactic-co-glycolic acid nanoparticles. (A) Mass spectrum comparison of ipilimumab and PEEPs–ipilimumab obtained by capillary zone electrophoresis–mass spectrometry. Both commercial and PEEPs-released ipilimumab share the same migration time. (B and C) Focus on mass-to-charge (m/z) spectrum from ipilimumab and PEEPs-released ipilimumab. Both share a close m/z value for the main peak and the same charge state distribution.

