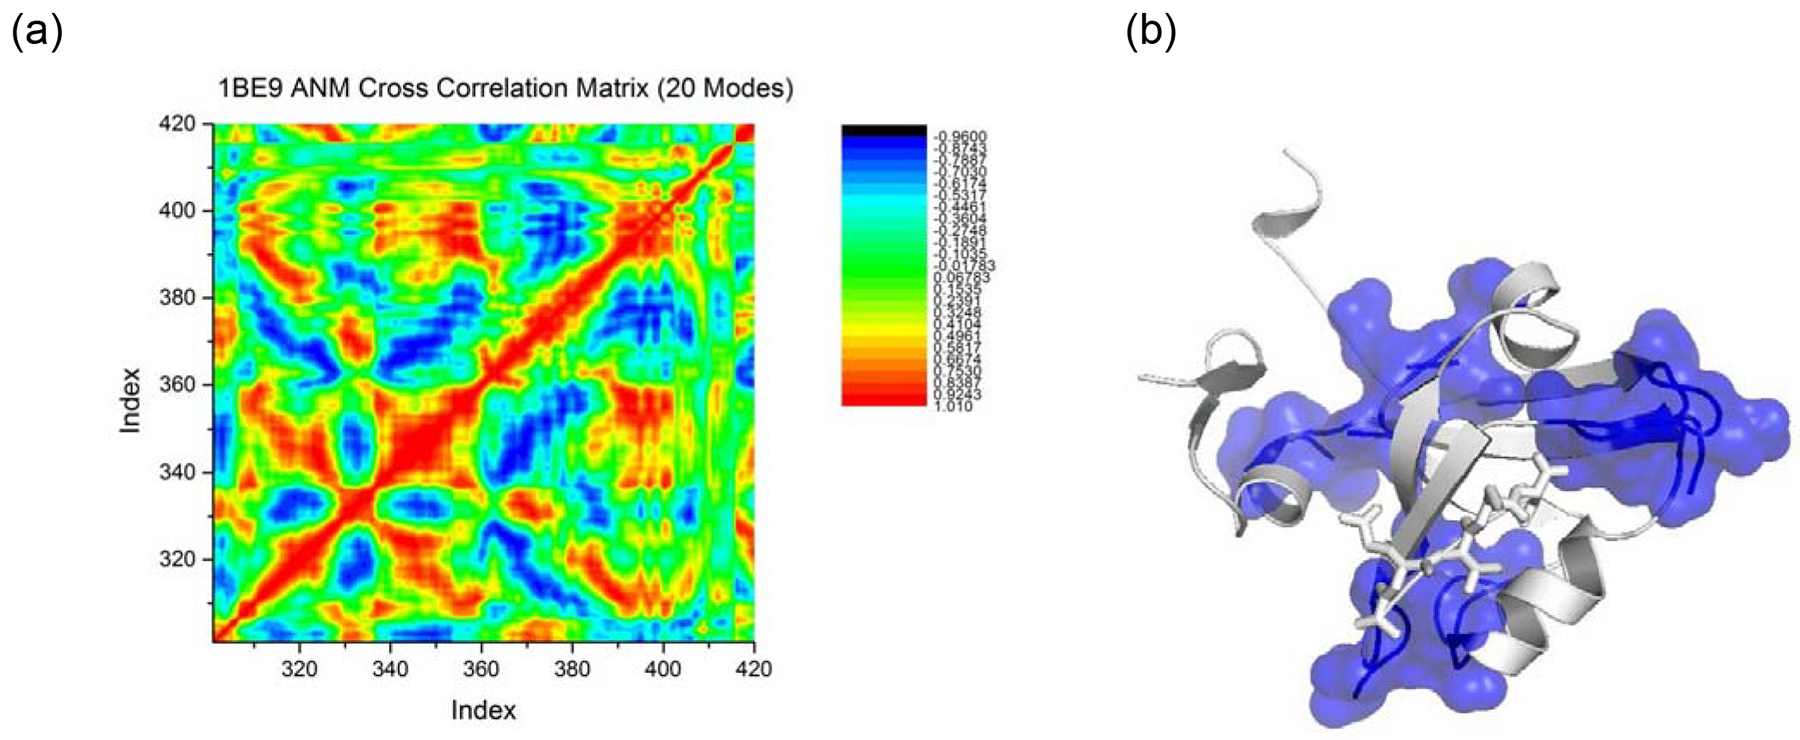
Figure 10.

Results of sector Analysis of PDZ3 based on ANM calculations. a): ANM correlation matrix; b: sector residues obtained from ANM, in sphere and surface representations. All ANM calculations were carried out using ProDy (Bakan, Meireles & Bahar, 2011).
