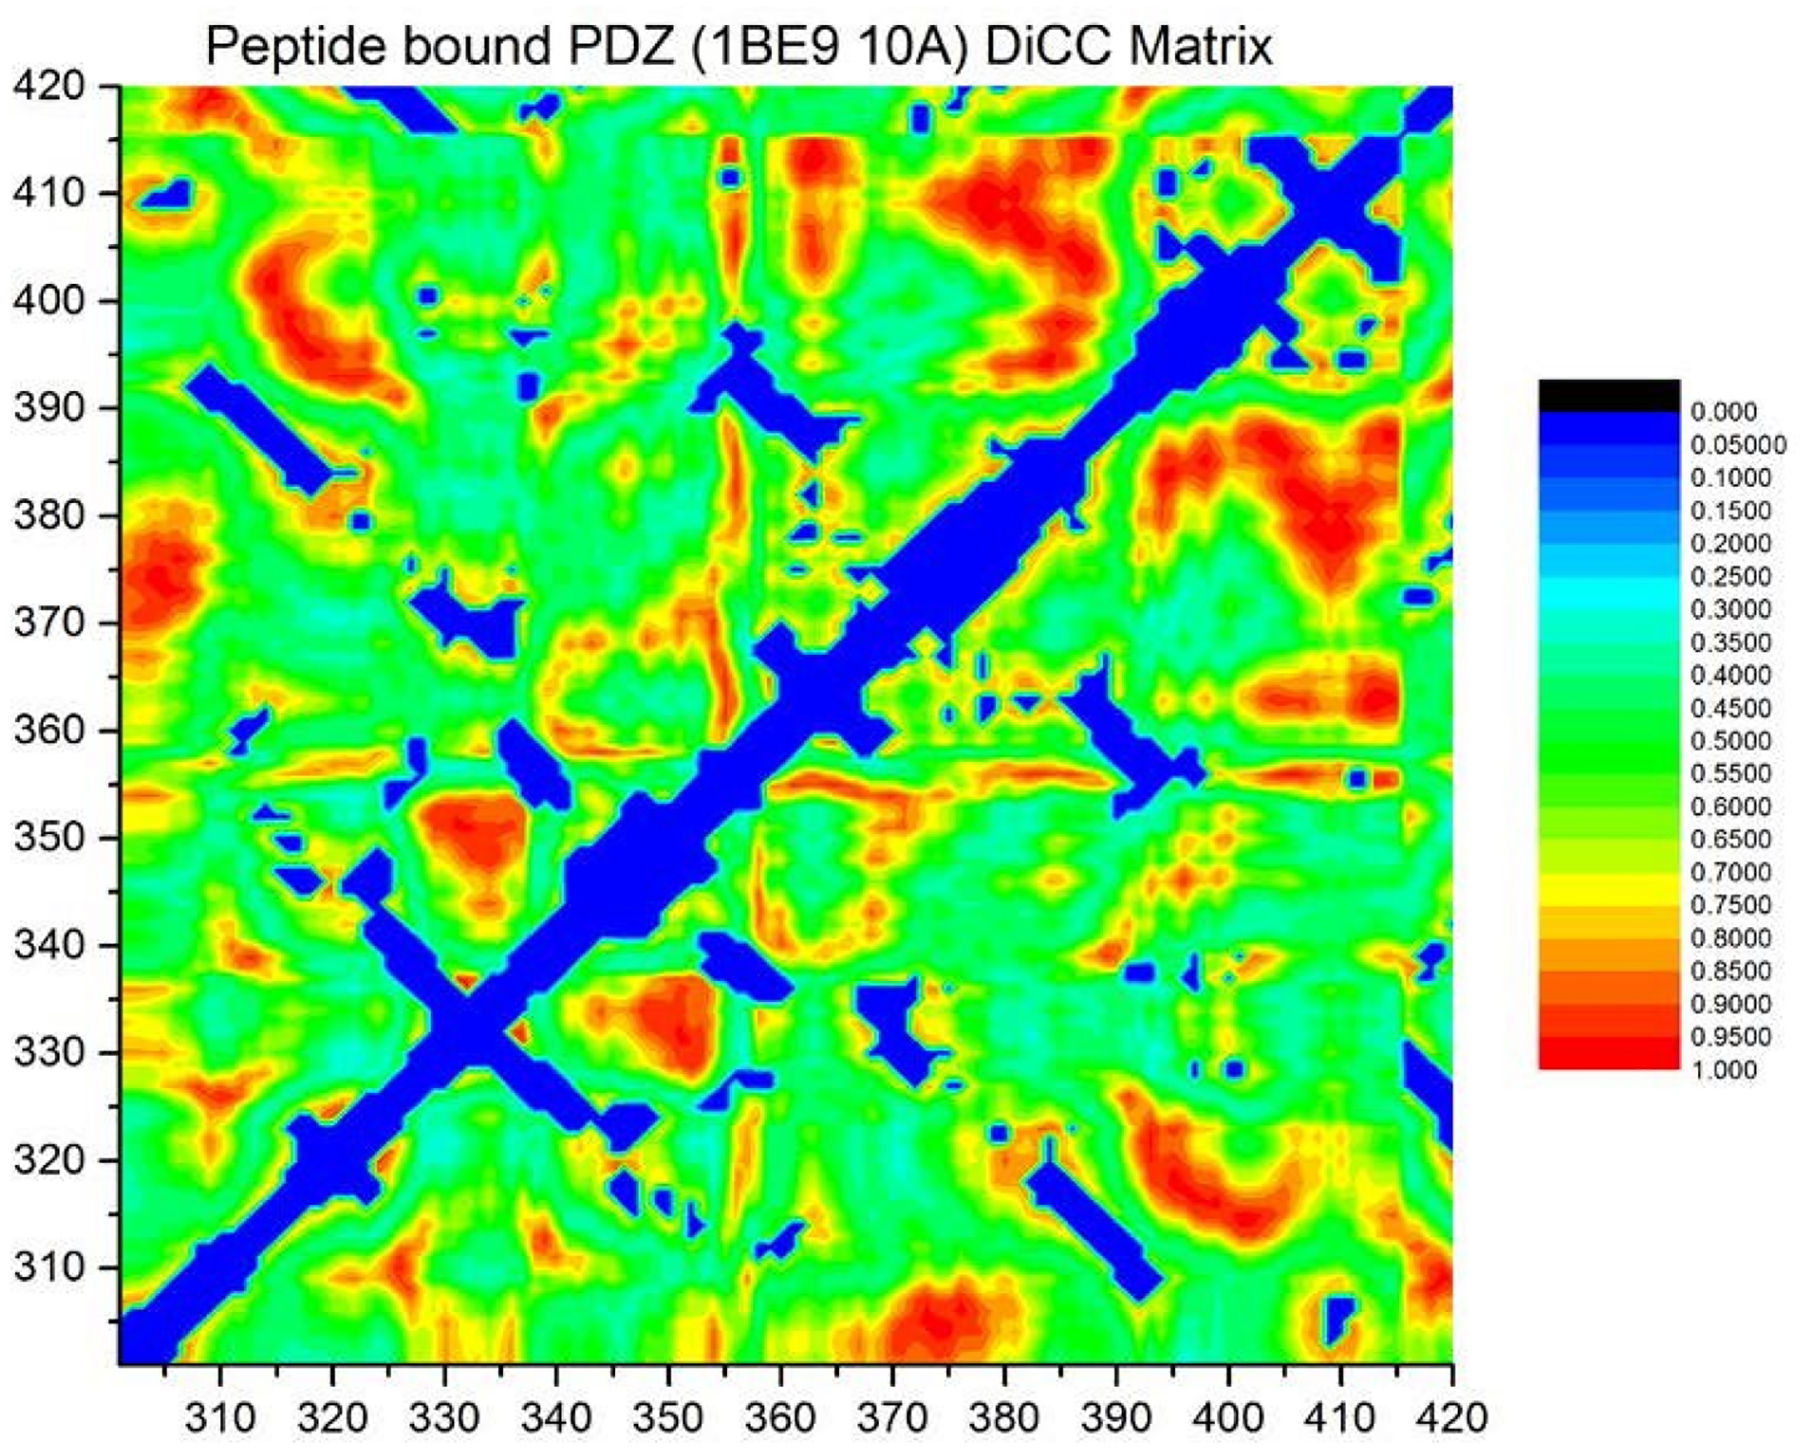
Figure 4. Heat map of the covariance matrix for fluctuations in MD calculated motional displacements <Δrij >.

The indices i and j run over amino acid residues in PDZ3. The regions in blue correspond to neighboring inter-residue contacts, based on an interatomic distance cutoff < 10 Å.
