Figure 7.

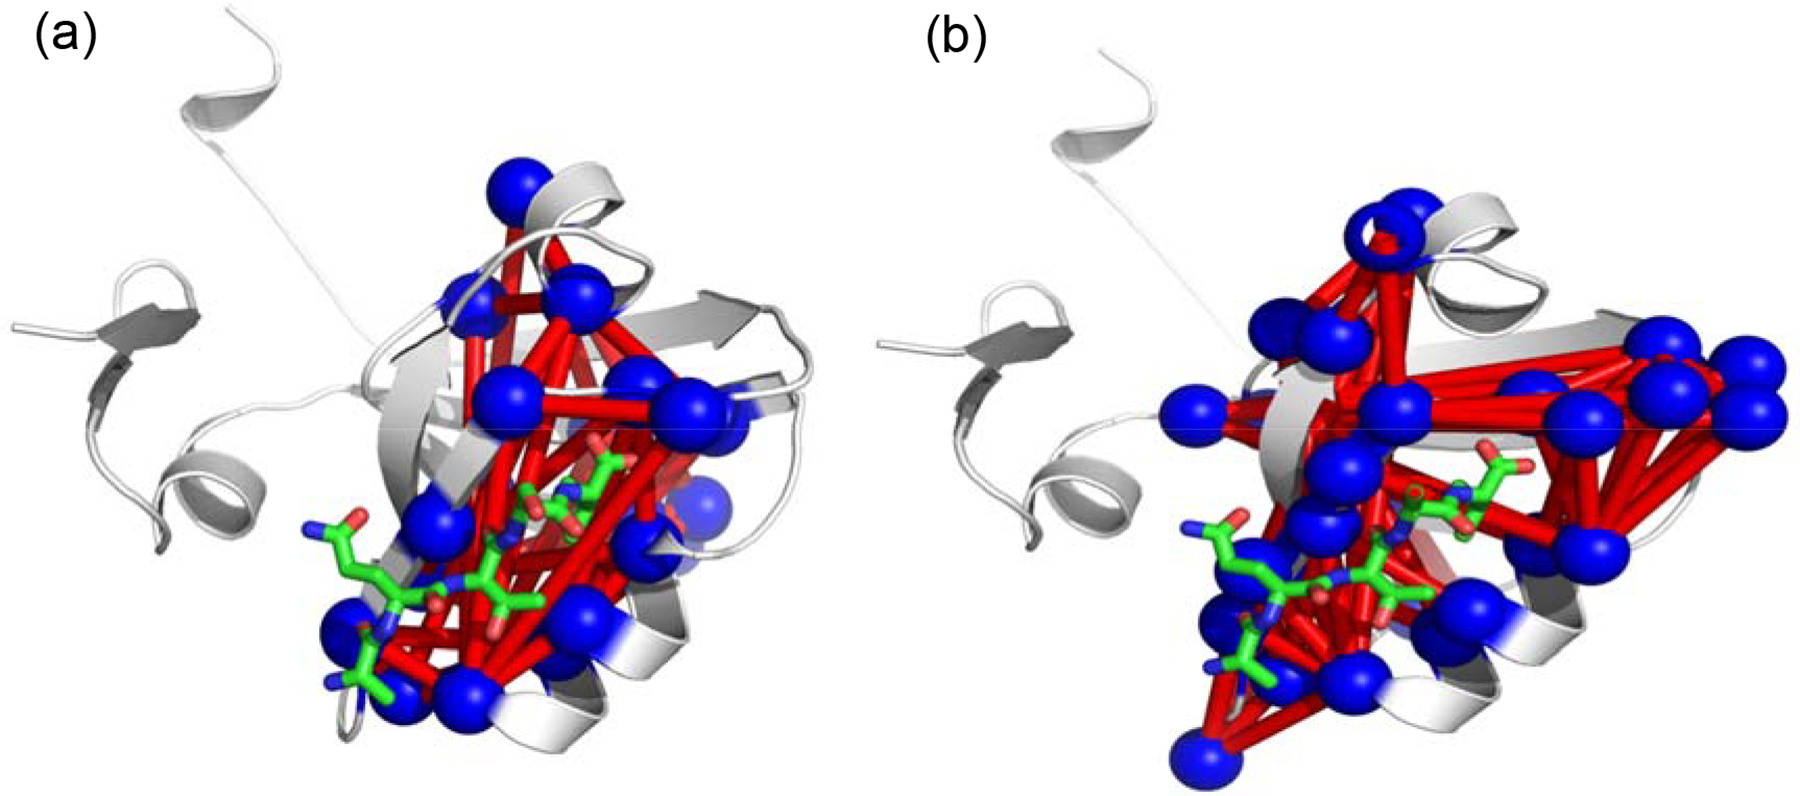
Pairwise links between a) MD and b) SCA sector residues, based on magnitude of correlations by residue. Plots were generated using the xPyder program (Pasi, Tiberti, Arrigoni, Papaleo, 2012)

Pairwise links between a) MD and b) SCA sector residues, based on magnitude of correlations by residue. Plots were generated using the xPyder program (Pasi, Tiberti, Arrigoni, Papaleo, 2012)