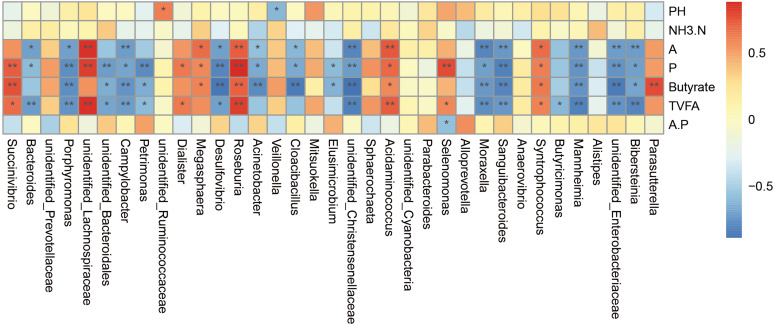
Figure 5. Spearman’.s correlation between the rumen bacterial communities (genus level) and phenotypic variables.
Red represents a positive correlation and blue represents a negative correlation. A is meaning Acetate, P is meaning Propionate, A.P is meaning Acetate/ Propionate. ∗ P < 0.05, ∗∗ P < 0.01.

