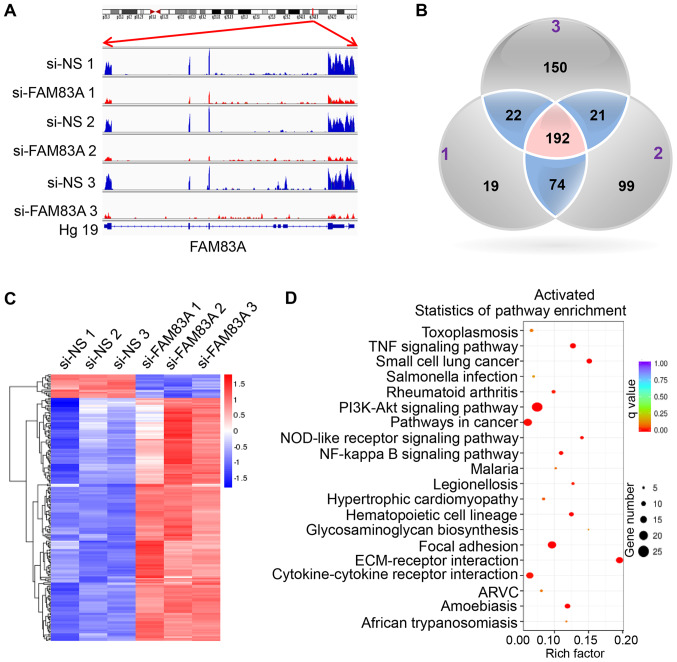
Figure 4.
Downstream transcriptional targets of FAM83A in HeLa cells. RNA sequencing analysis was performed on HeLa cells transfected with si-NS or si-FAM83A. (A) Read coverage maps demonstrating the RNA expression levels of FAM83A in the si-FAM83A and si-NS groups. Samples si-NS 1-3 were three independent repeats of si-NS-treated HeLa cells; samples si-FAM83A 1-3 were three independent repeats of HeLa cells transfected with si-FAM83A. Distribution of FAM83A reads was visualized along with the FAM83A gene transcript using the Integrative Genomics Viewer. (B) Venn diagram depicting the overlapping genes differentially expressed following FAM83A knockdown in HeLa cells. The numbers (1-3) in the Venn diagram indicate the three independent replicates. (C) A heatmap of the 192 differentially expressed genes from the RNA-seq experiment following FAM83A knockdown. Red represents upregulation; blue represents downregulation. (D) The top 20 most significant Kyoto Encyclopedia of Genes and Genomes pathways activated in response to FAM83A inhibition. FAM83A, family with sequence similarity 83 member A; si, small interfering RNA; si-NS, scrambled control; Hg19, human genome version 19.

