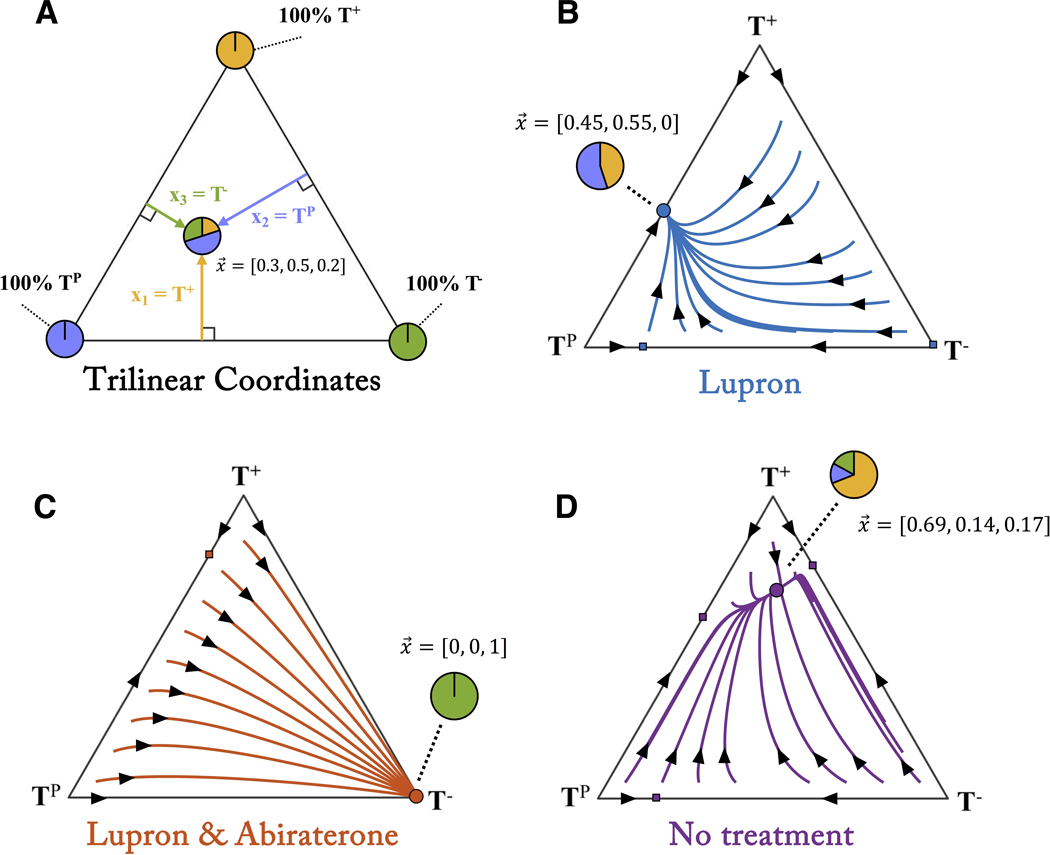
Figure 4: Temporal dynamics under therapy.
(A) A “trilinear” coordinate system represents every possible state of the tumor’s 3 cell types (x = [x1, x2, x3]) inside the triangle. The corners represent 100% of each particular cell type while interior points represent a fraction of each cell type. (B) Temporal dynamics are traced along trajectories for Lupron treatment (blue lines with arrows). Each point inside the triangle leads to an equilibrium state of TP and T+ cells (blue circle). (C) Similarly, Lupron & Abiraterone treatment leads all dynamics to the 100% T− equilibrium state (red circle). (D) The tumor still evolves without treatment, to an equilibrium of mostly T+ cells (purple circle).

