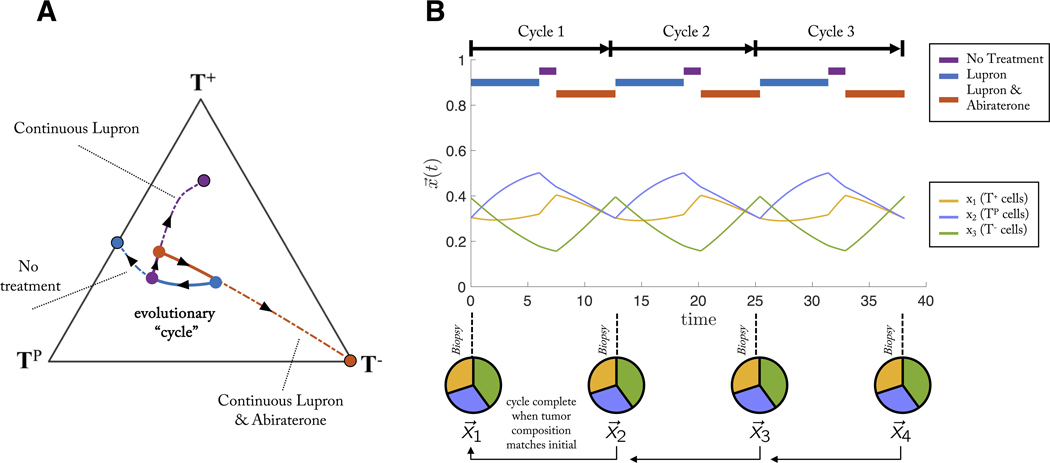
Figure 5: Sequential treatments which lead to an evolutionary cycle.
An evolutionary cycle employs a succession of sequential treatments which returns the state of the tumor composition back to the initial state at the start of treatment. (A) For example, a patient with an initial condition of roughly equal fractions of each cell type (blue circle) might be administered Lupron for some time (blue line), switch to no treatment (purple line), and switch to Lupron & Abiraterone (red line), which arrives back at the same initial condition: an evolutionary cycle. This progression can be repeated, controlling the tumor. Alternatively, the dashed line show dynamics under continuous treatment, leading to respective equilibrium states, spiraling out of the evolutionary cycle. (B) The identical evolutionary cycle paradigm is shown with cell fraction, x, over time.

