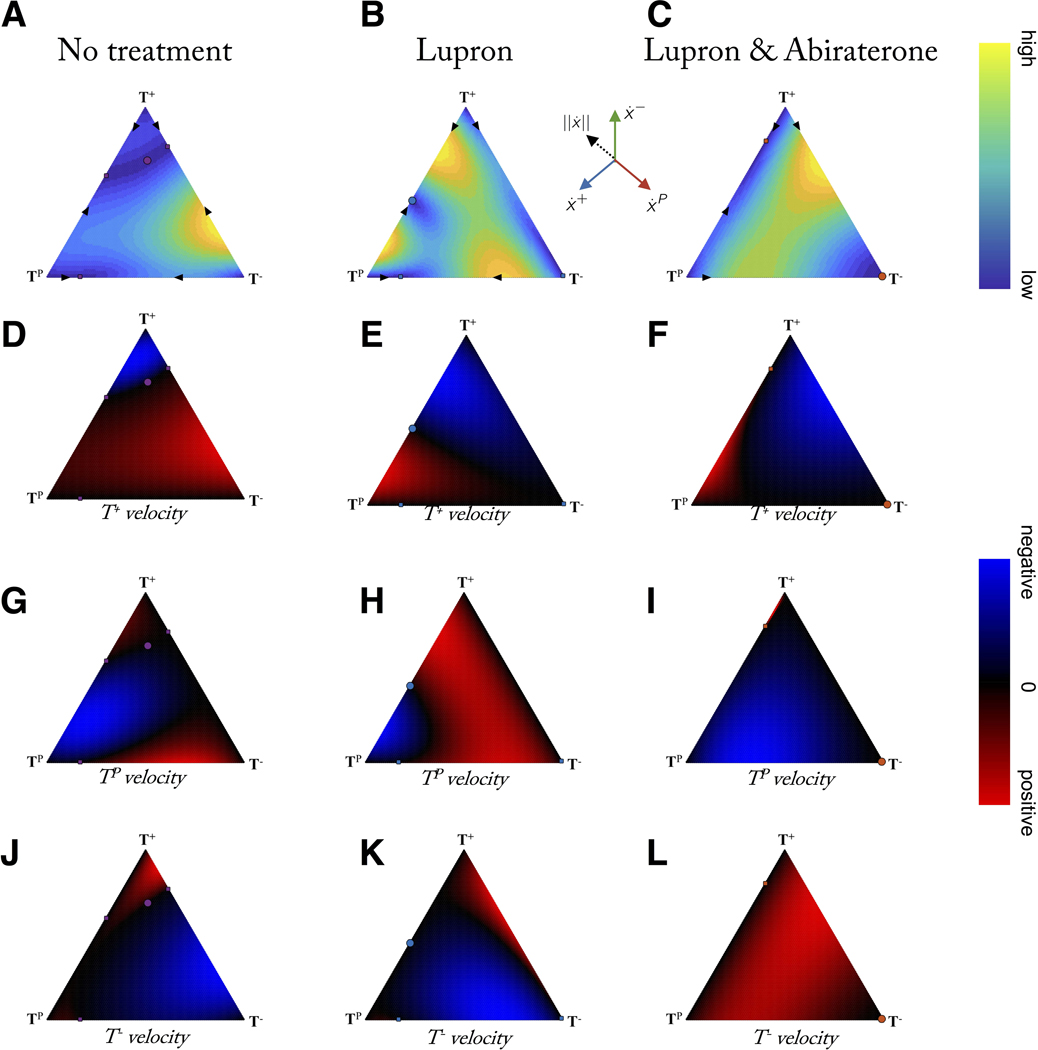
Figure 7: Evolutionary velocity before and during therapy.
Columns show evolutionary velocity of simulations identical to figure 4 for no treatment, Lupron, and Lupron + Abiraterone. A-C: note that no treatment is characterized by mostly slow velocities (blue) while adding treatments increases velocities, except when approaching evolutionary stable points (circles). D - L: rows show subpopulation relative velocity for T+ (D, E, F), TP (G, H, I), and T− (J, K, L). Adaptive therapy relies on the suppression of the resistant population (T−) by the sensitive populations (T+, TP) during treatment holidays (first column). This is only possible in certain a subset of the state space (blue; where T− velocity < 0). Velocities calculated by eqn. 1: see Supporting Information.

