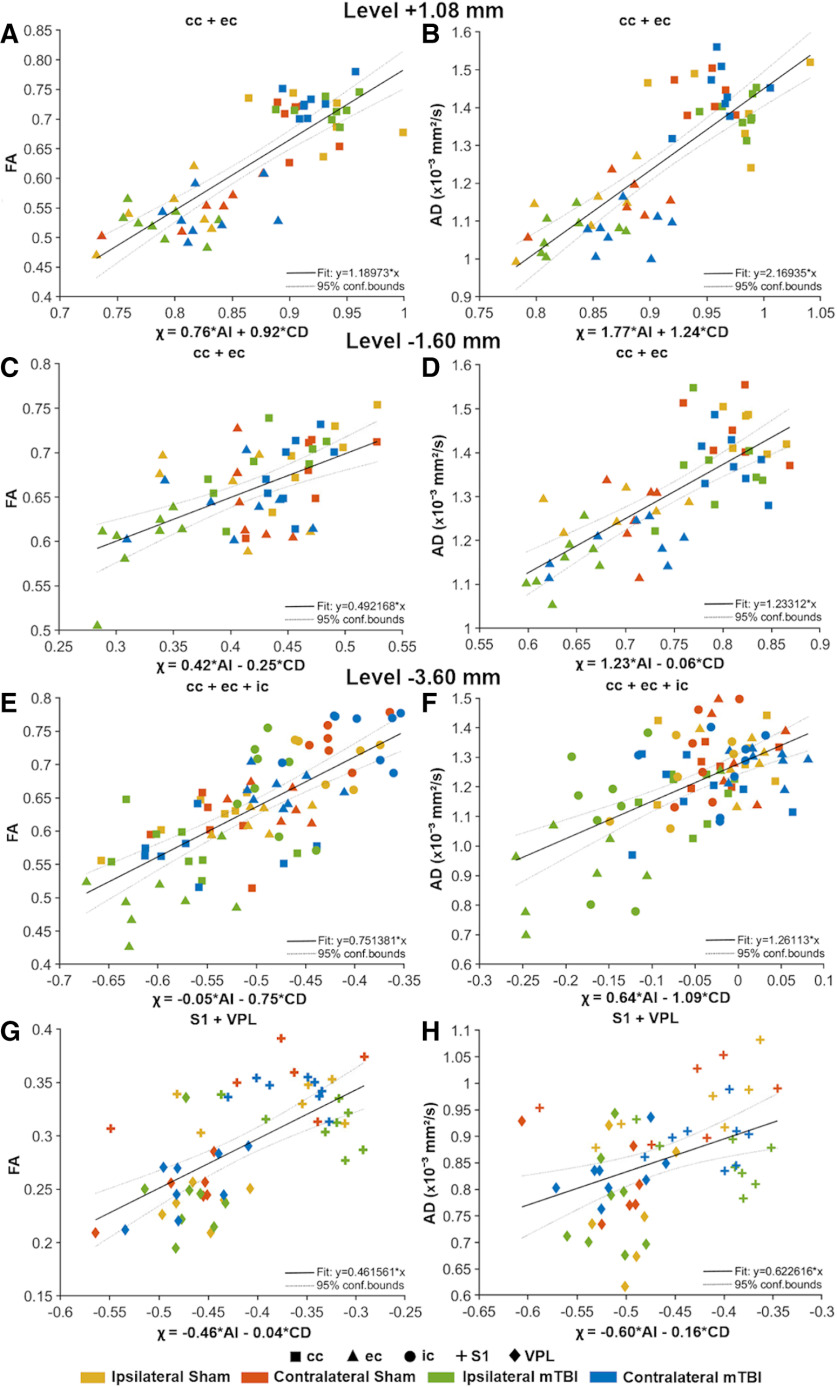
Figure 9.
Representative multiple linear regression analyses of quantitative DTI and histologic analysis parameters at +1.08 mm (A, B), −1.60 mm (C, D), and −3.60 mm (E–H) from bregma. The thick black line is the regression line, and the two thin dotted lines represent the 95% confidence interval. Both sham-operated and mTBI animals (ipsilateral and contralateral hemispheres) are represented by colors, and the brain areas by shapes. The x-axis represents the χ values obtained with the expression: χ = βAI × AI + βCD × CD, where β is the weighting value. The y-axis represents FA or AD (×10−3 mm2/s). CD values are scaled (×10−2 cell/μm2). AD, axial diffusivity; AI, anisotropy index; cc, corpus callosum; CD, cell density; ec, external capsule; FA, fractional anisotropy; ic, internal capsule; S1, somatosensory cortex; VPL, ventral posterolateral thalamic nucleus.

