Figure 7.
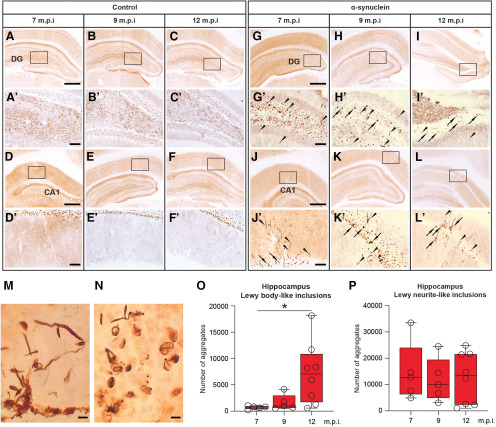
Representative micrographs illustrating, on the coronal plane, the negligible expression of PK-resistant α-syn immunoreactivity at seven, nine, and 12 months postinjection in the hippocampal DG (A–C, insets shown in A’–C’) and in the CA1 region (D–F, insets shown in D’–F’) of control rats. Progressive aggregation of α-syn after injection of recombinant mouse α-syn fibrils into the hippocampus. Compared with control, a strong PK-resistant α-syn immunoreactivity was found at seven, nine, and 12 months postinjection in the DG (G–I, insets shown in G’–I’) and in the CA1 region (J–L, insets shown in J’–L’) of injected rats. PK-resistant α-syn aggregates occurred as darkly stained LB-like (arrows) and LN-like deposits (arrowheads) and are shown at higher magnification in M, N. Box-whiskers plots illustrate the stereologically estimated numbers at different time points ± min to max value of LB-like (O) and LN-like (P) inclusions in the hippocampus of rats injected with the α-syn fibrils. Scale bars: 500 μm (in A, D, G, J for A–C, D–F, G–I, J–L), 100 μm (in A’, D’, G’, J’ for A’–C’, D’–F’, G’–I’, J’–L’), and 5 μm (M, N). Asterisk in O indicates significant time-dependent changes at p < 0.05.

