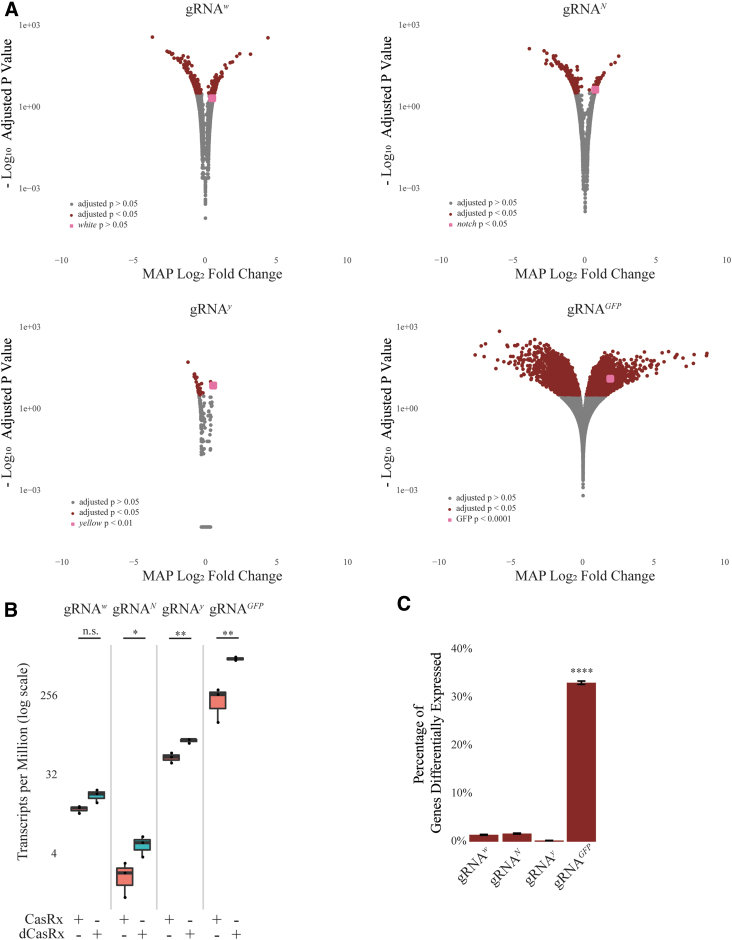
Fig. 4.
Quantification of potential CasRx-mediated on/off target activity. (A) Maximum a posteriori estimates for the logarithmic fold change of transcripts. DESeq2 pipeline was used for estimating shrunken Maximum a posteriori logarithmic fold changes. Wald test with Benjamini-Hochberg correction was used for statistical inference. Grey dots represent transcripts not significantly differentially expressed between Ubiq-CasRx and Ubiq-dCasRx group (P > 0.05). Red dots represent transcripts significantly differentially expressed between CasRx and dCasRx group (P < 0.05). Pink dot identifies the respective CasRx target gene for each analysis (P-value indicated in th/by inset). (B) Transcript expression levels (TPM) of transcripts targeted with CasRx or dCasRx. Student's t-test was used to calculate significance (w: P = 0.07; N: P = 0.04; y: P = 0.006; GFP: P = 0.008). (C) Percentage of transcripts significantly differentially expressed resulting from CasRx cleavage. A pairwise two-sample test for independent proportions with Benjamini-Hochberg correction was used to calculate significance. LFC, logarithmic fold change; MAP, Maximum a posteriori.

