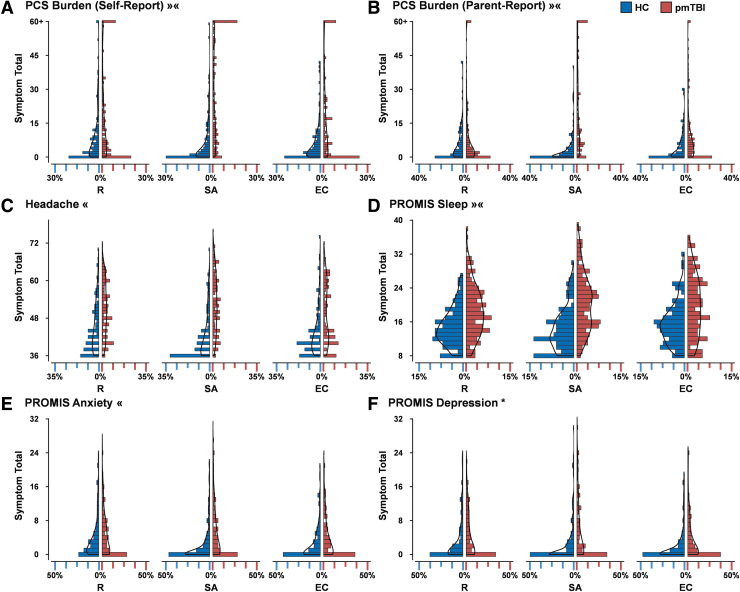
FIG. 1.
Distributions of clinical measures. Histograms (bin = 1) represent the percentage (X axis) of healthy controls (HC; blue shading) and pediatric patients with mild traumatic brain injury (pmTBI; red shading) with various total symptom scores (Y axis) across retrospective (R), subacute (SA), and early chronic (EC) assessments. Density plots (solid black line) are overlaid on all histograms. The X axis is scaled to approximate the maximum percentage value among the six distributions for each symptom inventory. The Post-Concussion Symptom Inventory (PCSI) includes both self- (A) and parent-report (B) versions, whereas the Headache Impact Test (HIT-6) (C) and Patient Reported Outcomes Measurement Information System (PROMIS) measures for sleep (D), anxiety (E), and depression (F) are child self-report only. Results from ANCOVA models, using R ratings as a covariate, are denoted for significant Group effects (*) and Group × Time interactions (« = group differences at SA only; »« = differences in magnitude across SA and EC periods).

