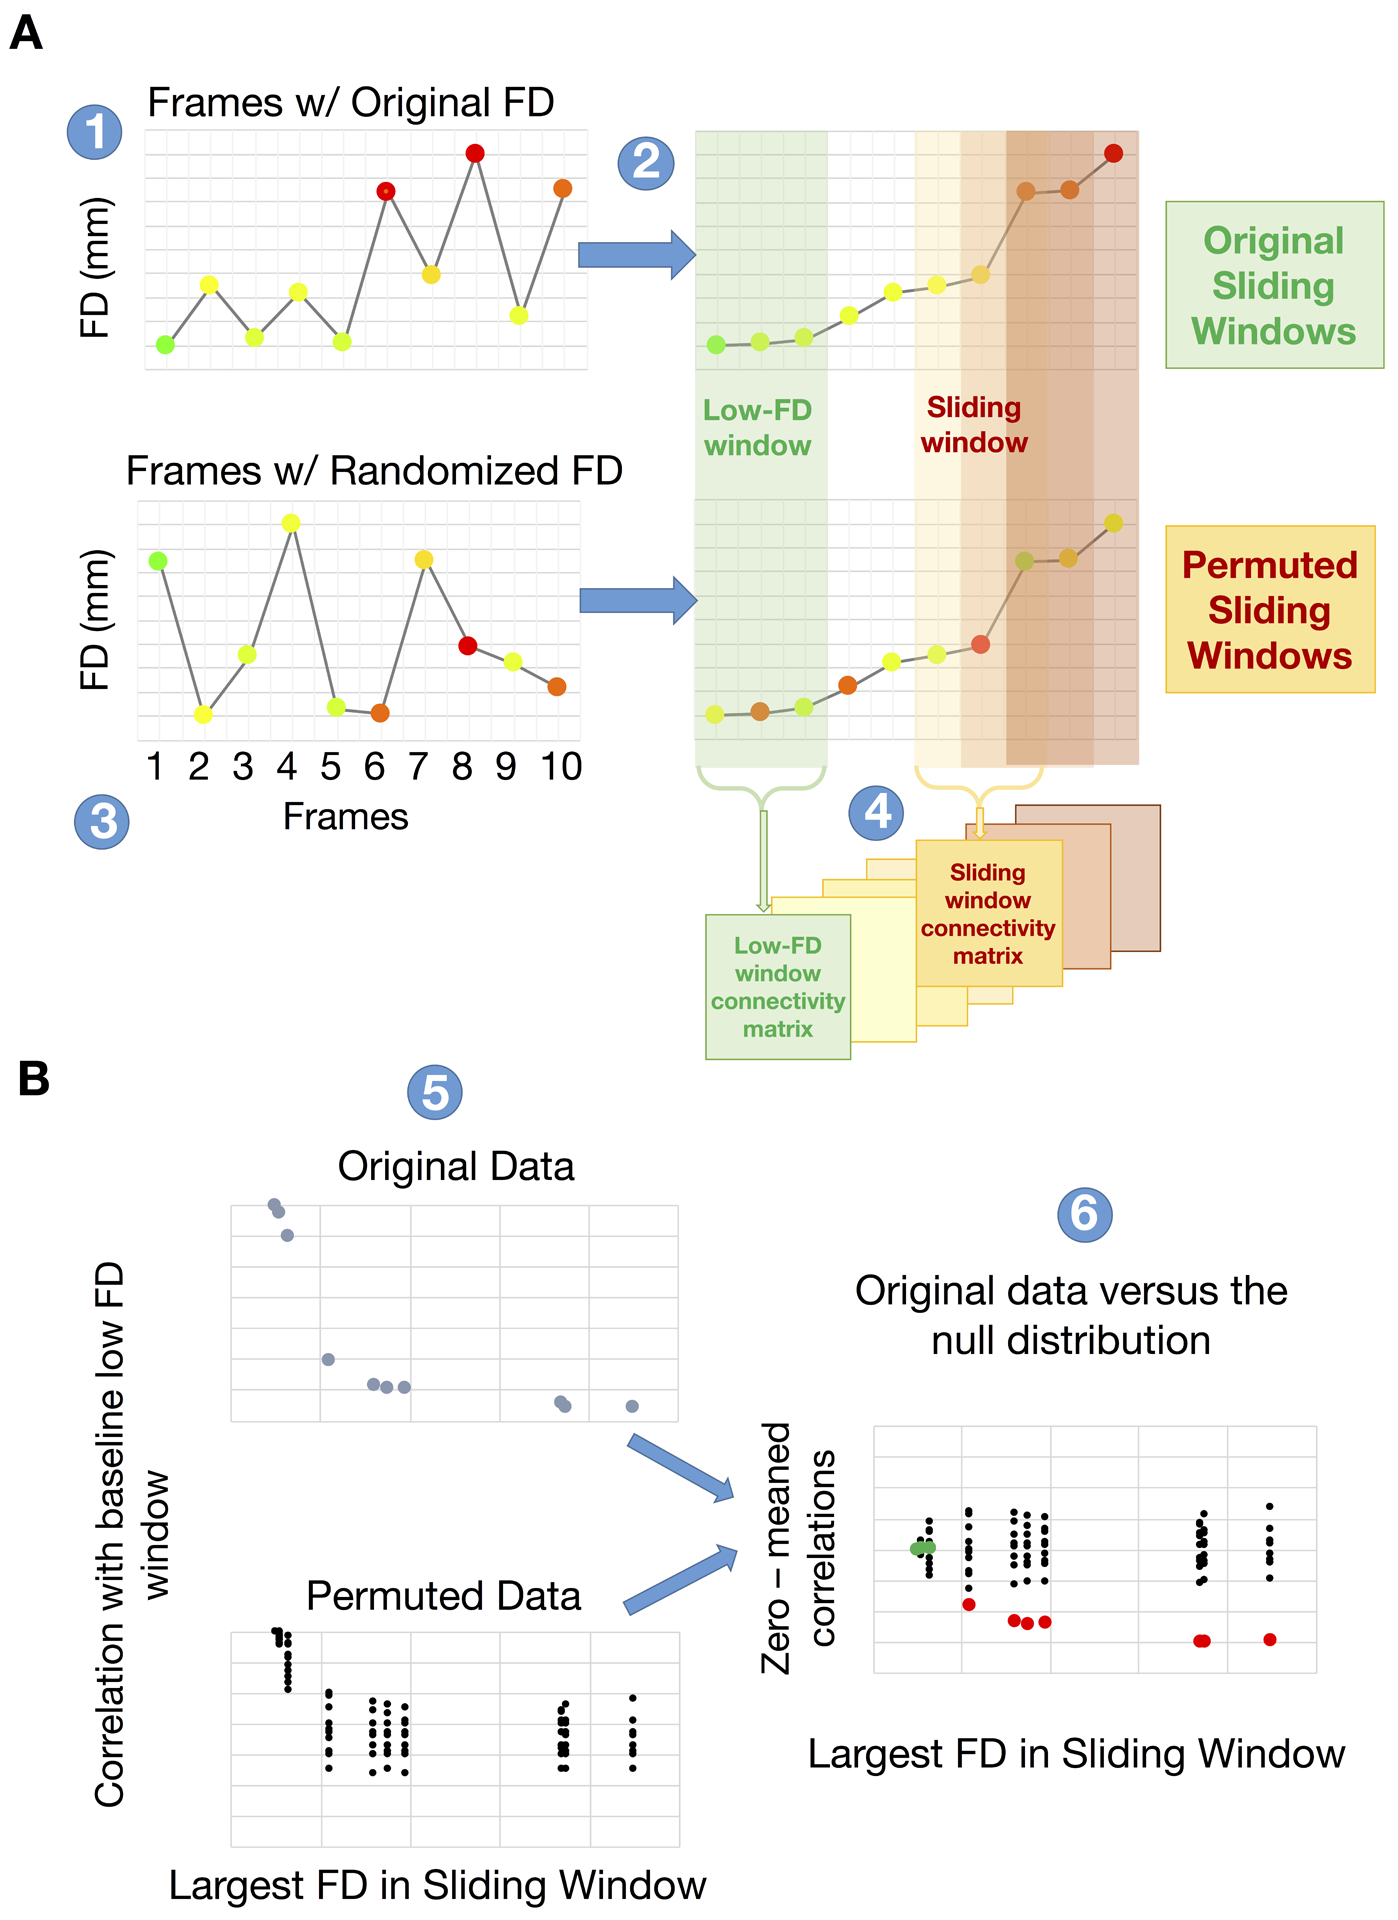
Figure 1. Demonstration of the systematic relation between frame displacement (FD) and functional connectivity (FC).

(A) (panel 1) All frames of a given fMRI run are ordered according to increasing FD values (panel 2). Functional connectivity matrices are computed over sliding windows of 150 volumes (i.e., 1–150, 2–151, …). The mean FC over the first 30 windows (lowest FD) defines a baseline FC matrix (green block in panel 2). To evaluate the statistical significance of the FC-FD relation, the frames are randomly reordered (250 permutations) and the procedure is repeated (panel 3). In panel 4, FC in successive windows (31–181, 32–182..) is evaluated and matrix similarity to the baseline FC is computed for both the original and permuted data. (B) A systematic relationship between FD and FC manifests as steadily declining matrix similarity at higher FD windows (blue dots in panel 5, top). The surrogate data generate a null distribution of FC matrix similarity values (black dots in panel 5, bottom). Comparison of FC similarity in the originally ordered windows to the null distribution reveals the FD value at which FC is significantly degraded by head motion (red vs. green dots; panel 6). For simplicity of visualization, the true and null distributions are zero centered.
