
Figure 2. Using the FD sliding window procedure (Fig. 1) to evaluate the success of FD filtering.
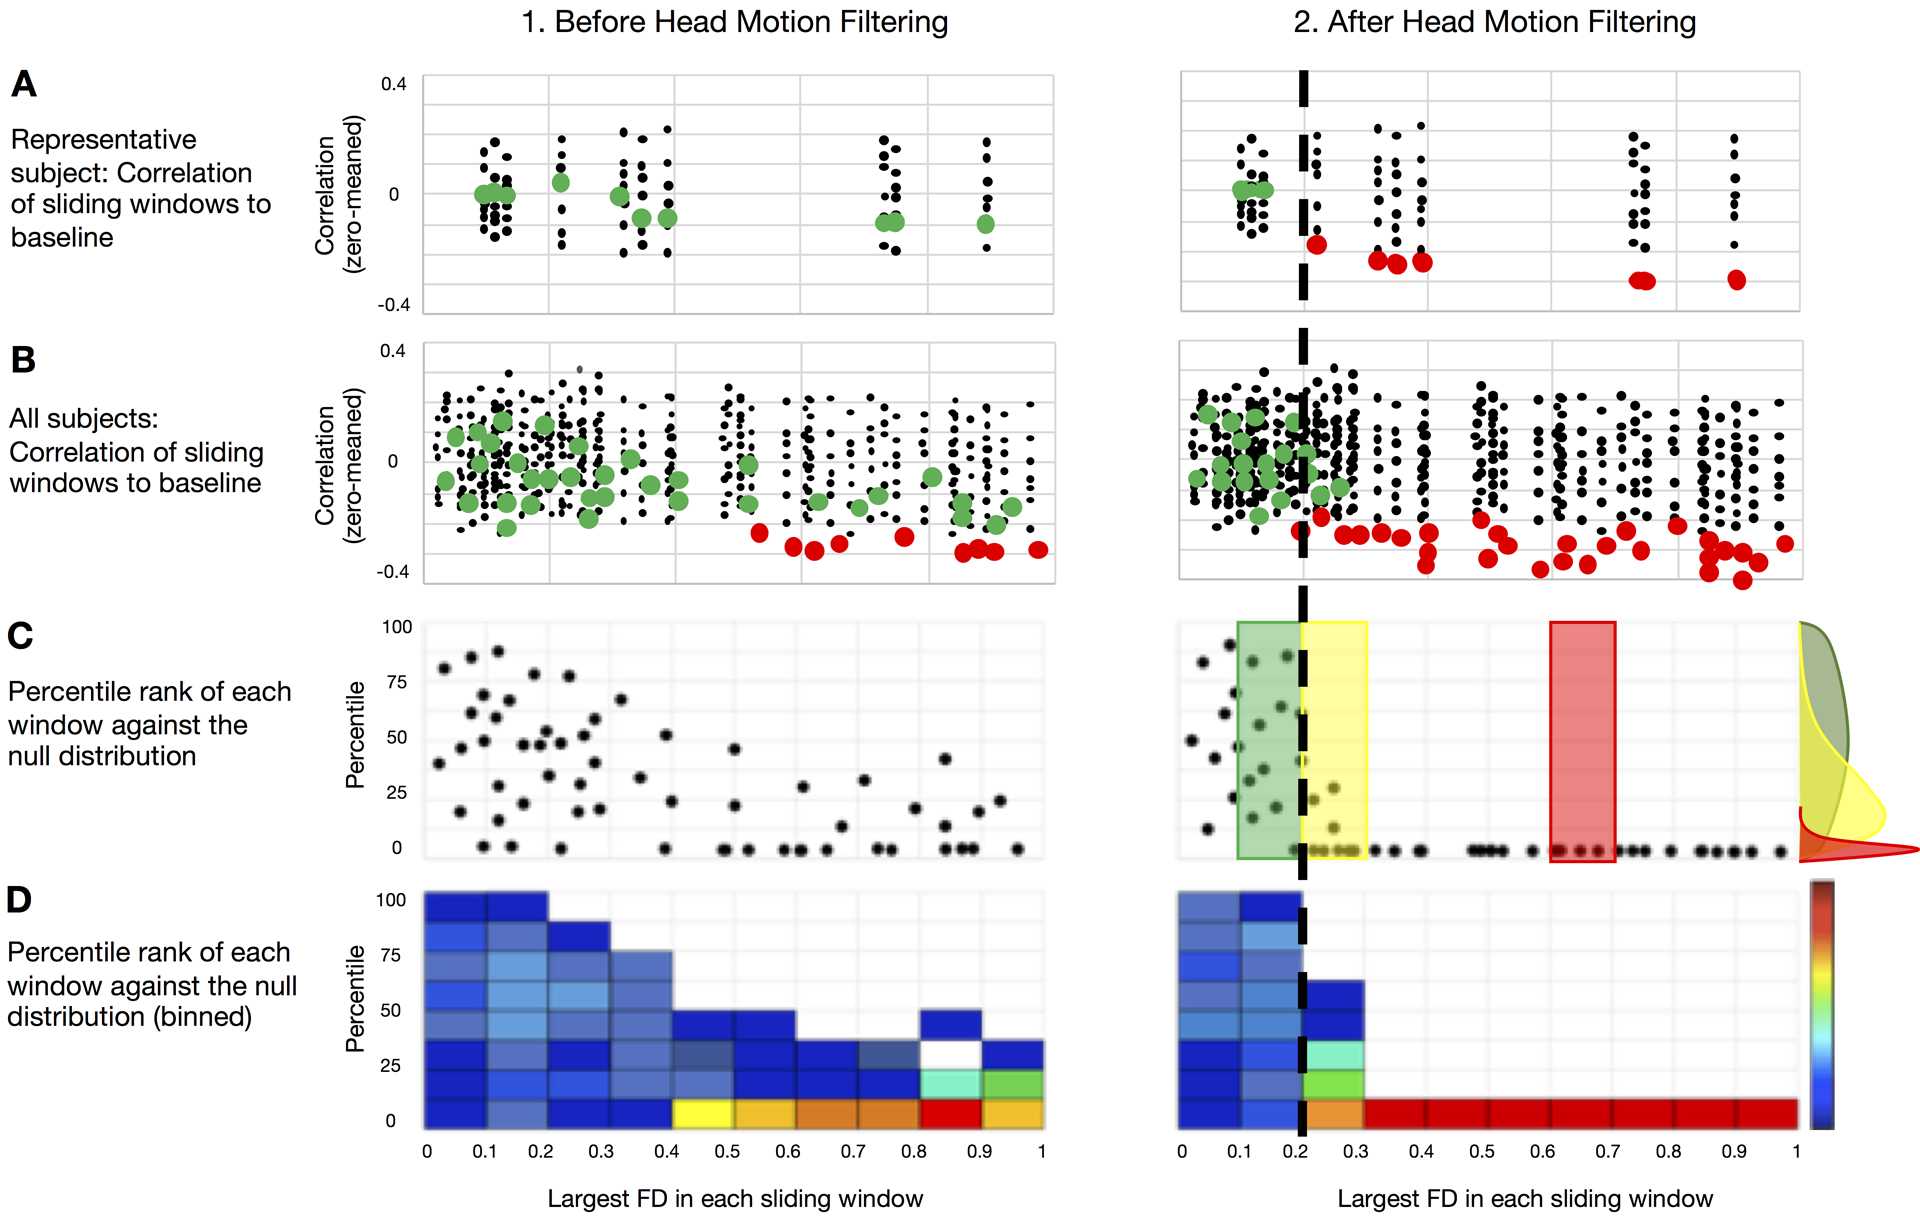
We provide a schematic demonstrating the evalution of the FD sliding window procedure. The objective here is to assess how well FD performs as a measure of data quality. (A) Correlations from the FD sliding windows are compared to the null for each subject for (1.) non-filtered and (2.) filtered FD measurements, colored by significance (green = ns; red = significant). (B) All sliding windows for all participants colored by significance for the unfiltered (1.) and filtered (2.) conditions. (C) Percentage rank (relative to null) of the QC-ordered correlations (from (B)) across subjects, which are binned and represented as a heat map, each dot represents one FD sliding window from one subject. If FD is a good measure of data quality then sliding windows with high FD should poorly match the low FD template, which will be represented in the skew of the distribution of rank orders. (D) Binned representation of (C) as a heat map. The cumulative distribution function (CDF) across all FD bins provides an estimate of the average rate at which the windows deviate from the null model. If the bins deviate from the null model rapidly with increasing FD, it means that FD is a good measure of data quality. The black dotted line represents the approximate level at which FD ordered outcomes deviate from random across individuals (i.e., where the distribution of ranks becomes skewed – illustrated with the colored distributions in (C).