
Figure 4. Augmented 2D grayordinate image intensity plots in a 9-year old ABCD-study participant.
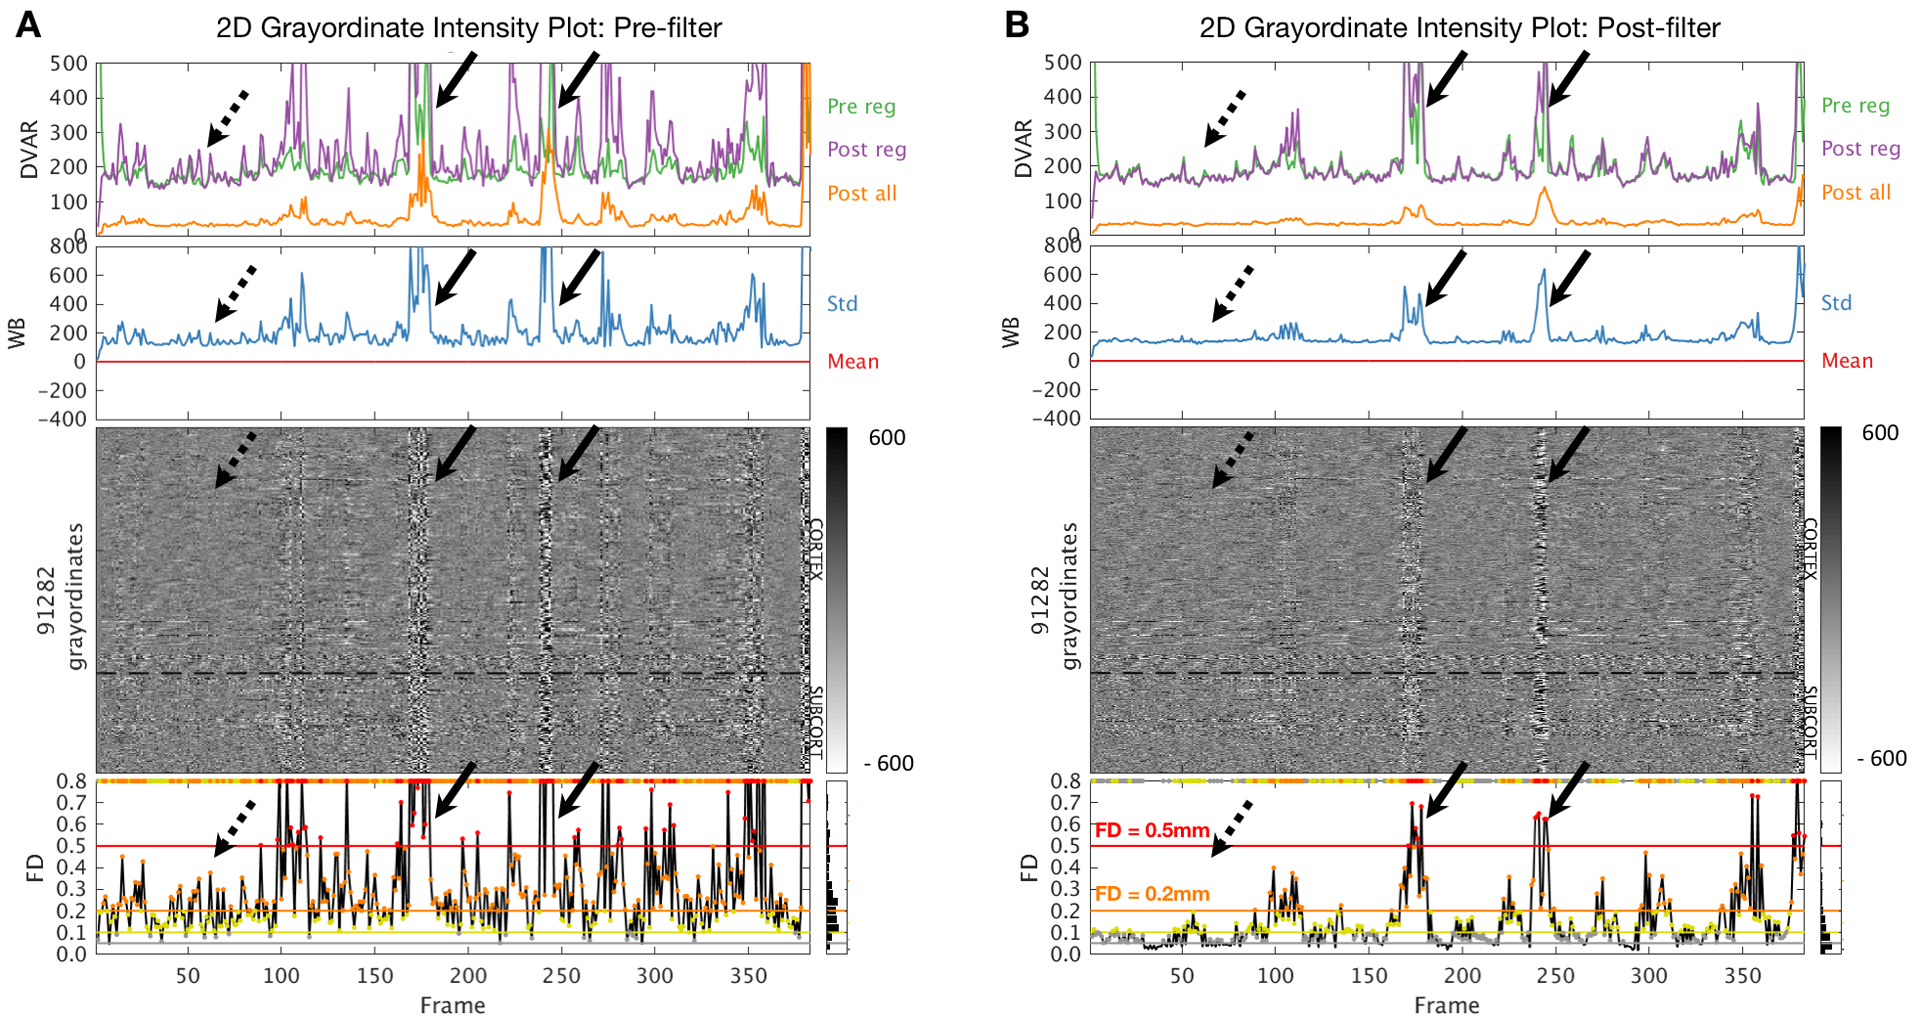
(A) Data processed without motion time series filtering. (B) Data processed with motion time series filtering (FF filter). Black arrows indicate large movement spikes associated with BOLD image artifacts. Motion time series filtering (panel B) removes high-frequency components in the FD trace that exceed censoring thresholds (FD > 0.2 orange; FD > 0.5 red) prior to filtering (panel A). Filtering leaves intact FD spikes associated with image artifact (solid black arrows). Dashed black arrows highlight smaller spikes of apparent motion without associated image artifact. Conventions as in Fig. 3.