
Figure 5. Frequency domain representation of motion time series in multiband data.
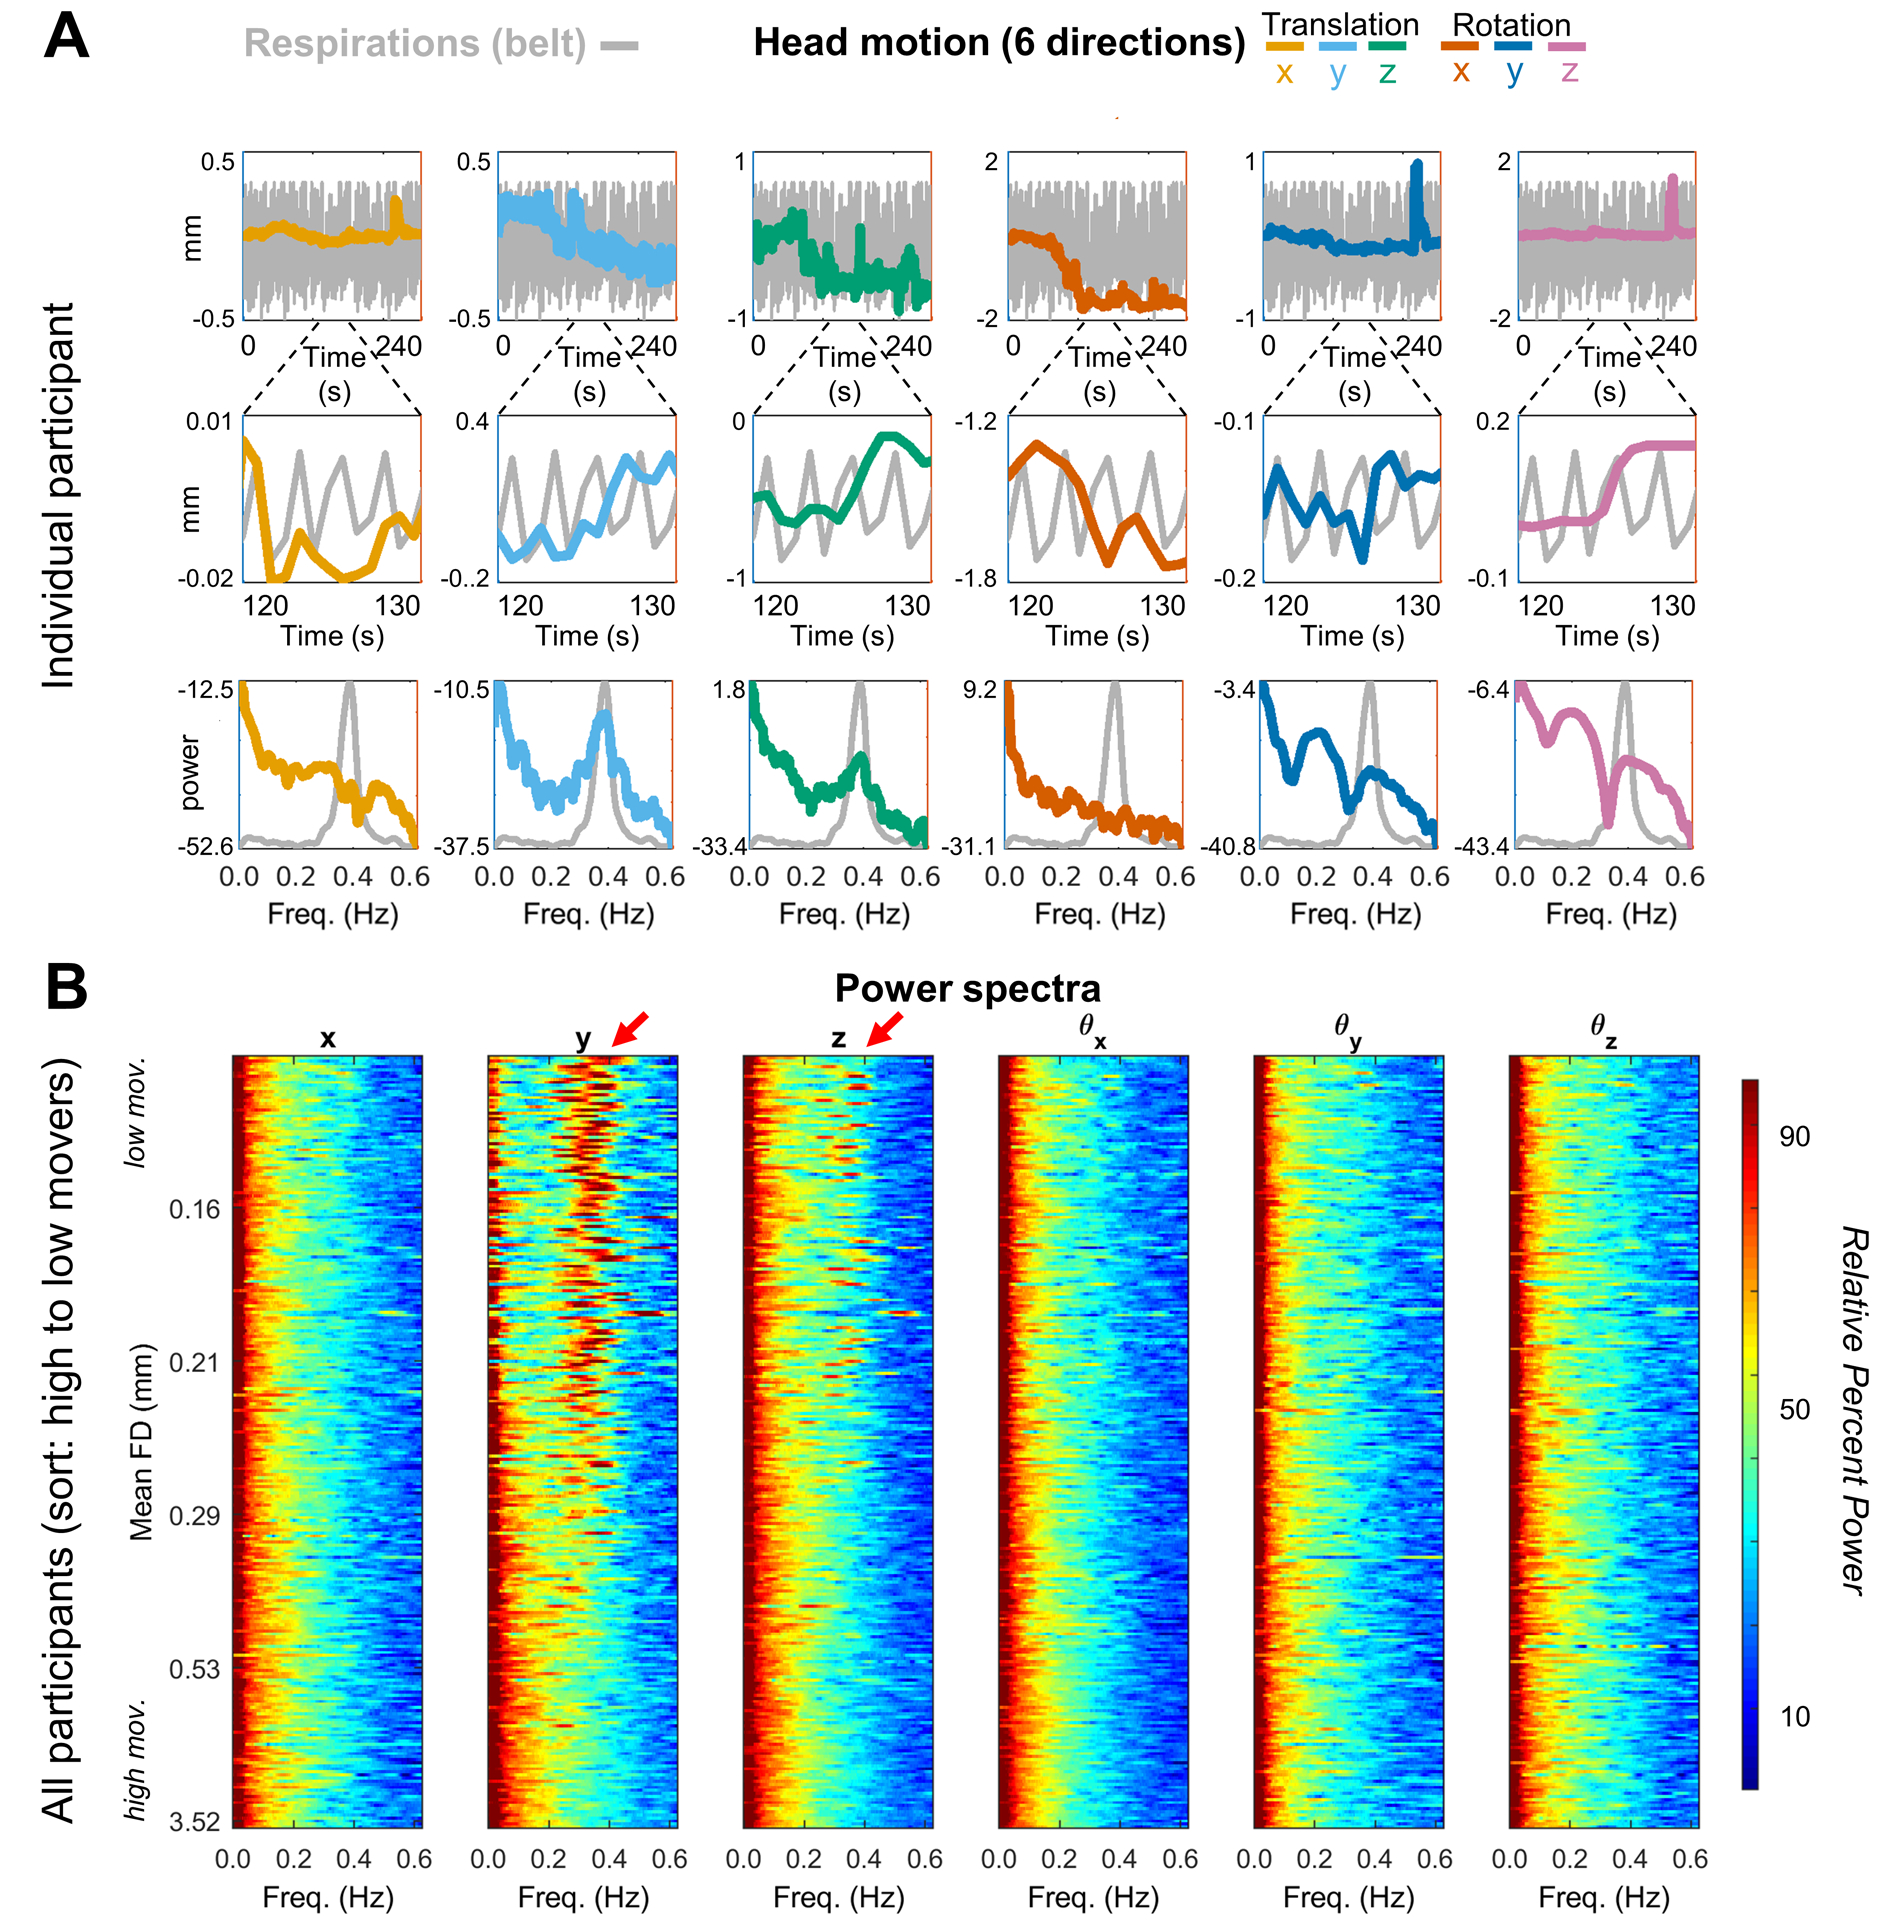
(A) One fMRI run in a single representative ABCD participant (TR = 800 ms). Colored lines represent the translation and rotation motion estimates. Top row: entire (240 s) fMRI run; middle-row: 10 s ‘snapshot’; Bottom row: power spectra of the motion and respiratory belt traces. (B) Power spectra of 62 OHSU ABCD-study participants (mean age 11.6, TR = 0.8s), ordered by mean FD and stacked with lowest movers on top. Red arrows highlight characteristic frequency of respiration artifact (~0.3 Hz). To allow for visual comparisons across a wide range of motion time series power, (i.e., with and without filtering – Fig. 5, Fig. 6 and SI Fig. 2 and 3) the spectra were first represented logarithmically (i.e., in dB) and then Z-scored (details in Appendix B); replication of these figures in one’s own data can be conducted with code provided by github.com/DCAN-Labs. Thus, the respiratory peak is suppressed in very high motion data, which are dominated by low frequency power.