
Figure 6. Frequency domain representation of motion time series in single band data.
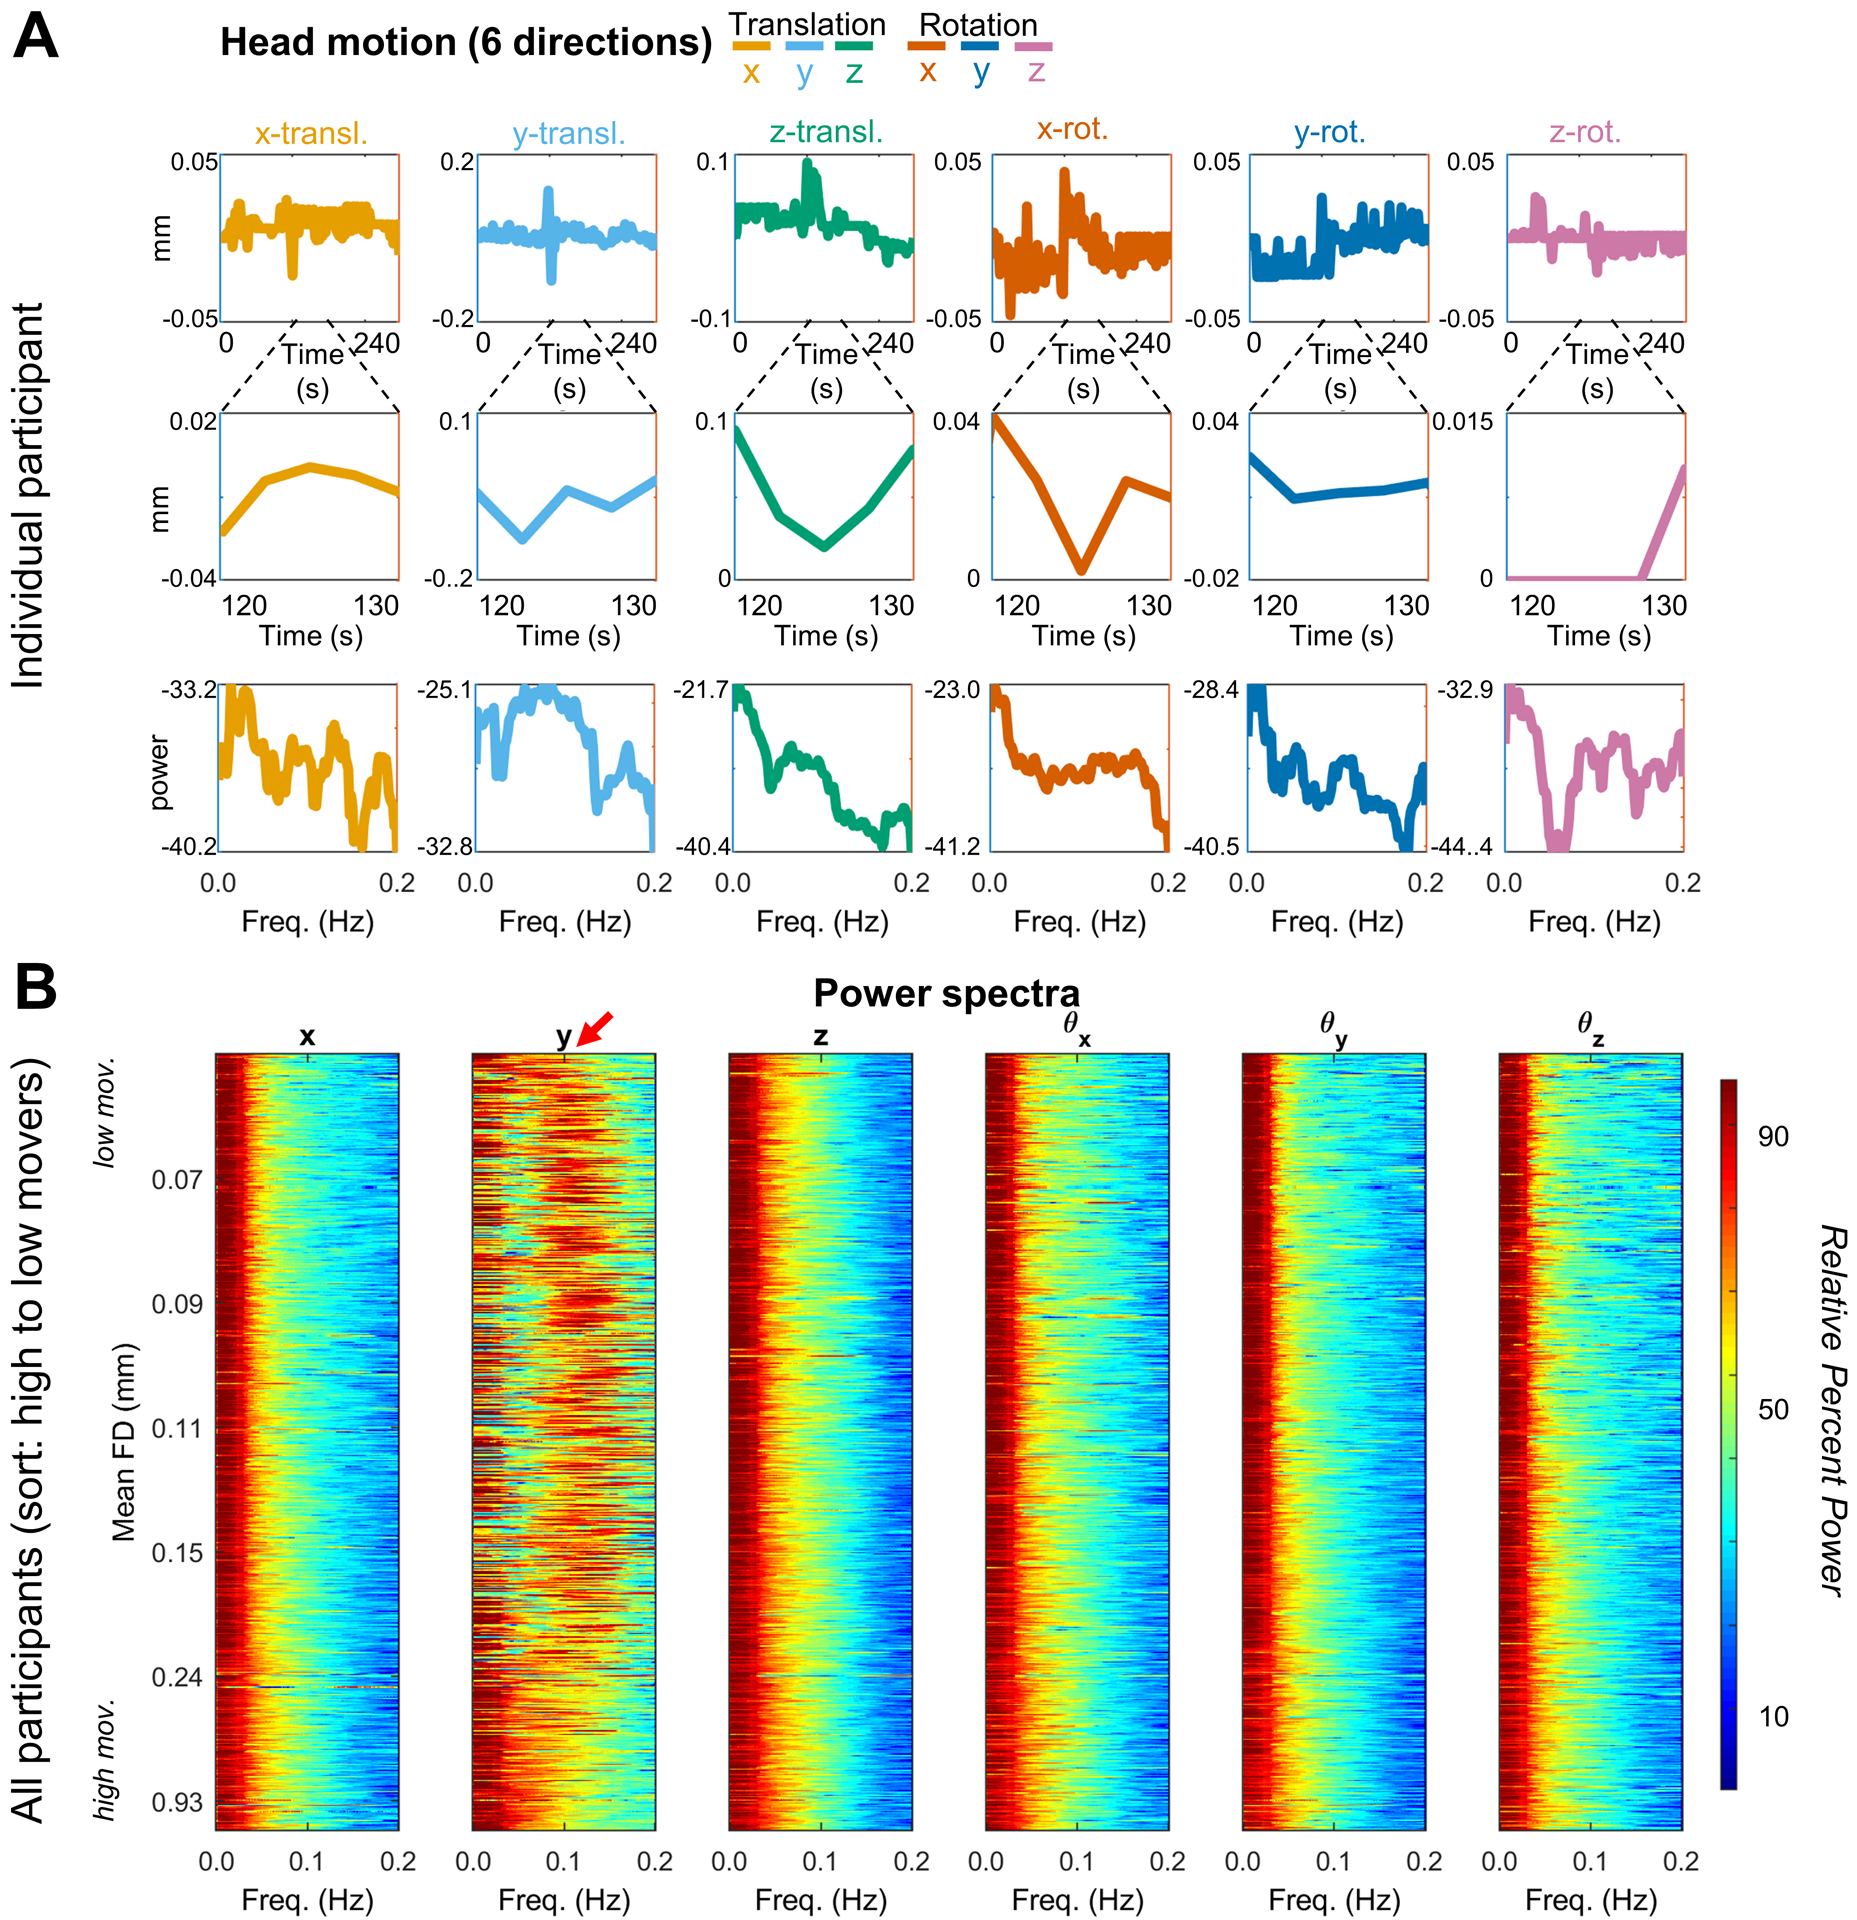
(A) One fMRI run in a single representative participant (TR = 2.5s). All display conventions as in Fig. 5A. (B) Power spectra of 321 OHSU scans (mean age 11.6, TR = 2.5s), ordered by mean FD and stacked with lowest movers on top. Red arrow highlights respiration artifact. As in Fig. 5B the spectra were first represented logarithmically (i.e., in dB) and then Z-scored (Appendix B). The respiratory spectral peak (presumed true center frequency ~0.3 Hz) is both comparatively broad in relation to the resolved spectral range (Nyquist folding frequency = 0.2 Hz) and aliased to ~0.1 Hz = 0.2 - |~0.3 – 0.2| Hz.