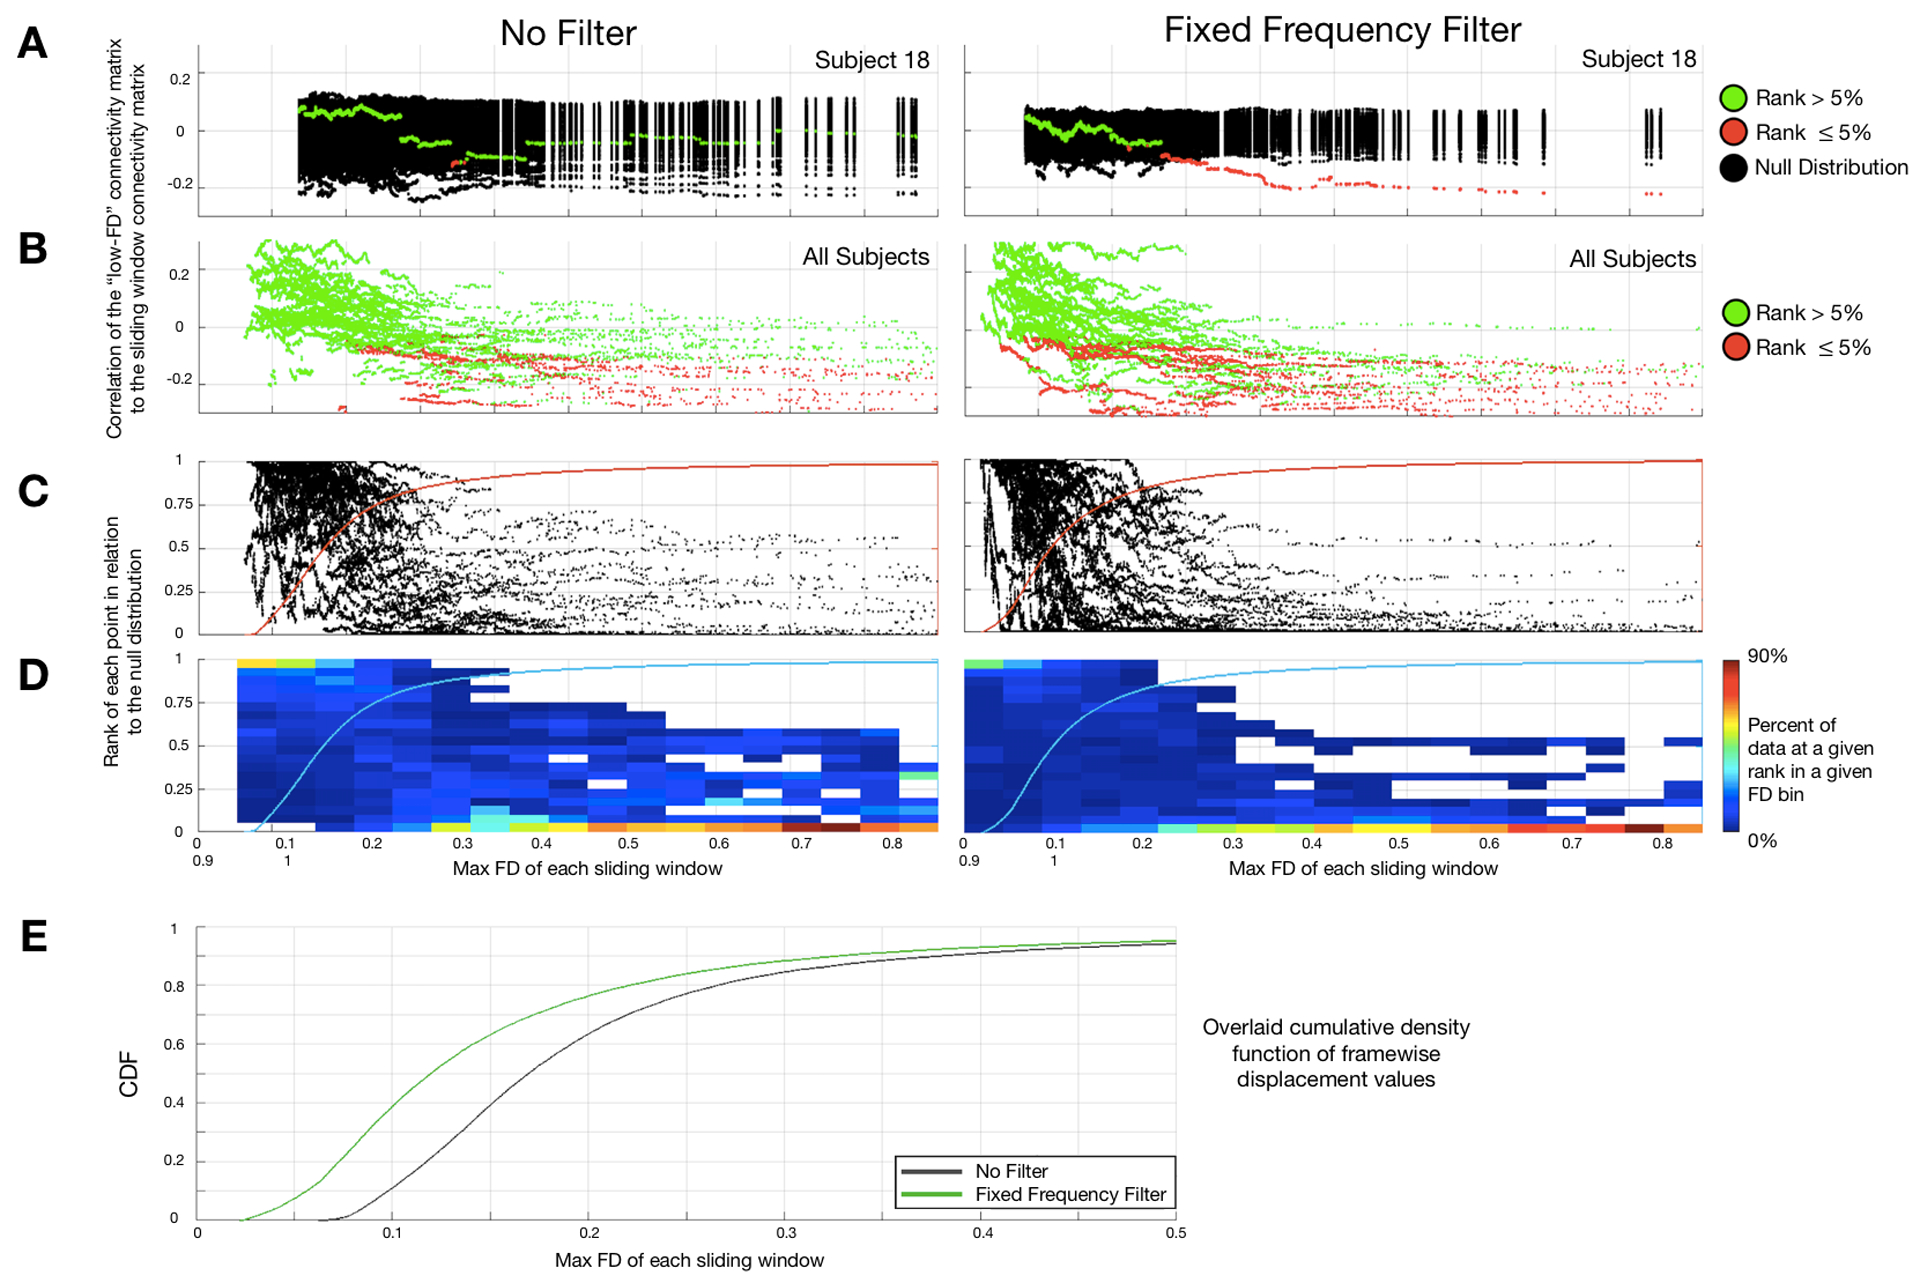
Figure 9. Demonstration that motion parameter filtering enhances the link between FD and FC.

This figure follows the logic illustrated in Fig. 2. “No-filter” and Fixed Frequency (FF) filter results are shown on the left and right, respectively. (A) Single participant results. Values in red are significantly different from random; values in green do not significantly differ from random. (As in Fig. 2, the true and null distributions are zero centered). Thus, absent motion parameter filtering, there is little relation between FD and FC. (B) Significance of all FD:FC associations for all subjects. Motion parameter filtering causes the appearance of a significant FD:FC relation to appear at lower rank-ordered FD values (8th %-tile vs. 20th %-tile). (C) Percentage rank (relative to null) of the FD-ordered FC outcomes across subjects. (D) Binned heat map as in Fig. 2D. (E) Cumulative distribution functions (CDFs) for the filter and ‘no filter’ results. These CDFs provide an estimate of the average rate at which windowed FC deviates from the null model. Filtering shifts the CDF to the left (green trace), i.e., improves the link between FC and motion estimation. This effect is statistically significant (p< 0.0001, Kolmogorov–Smirnov (KS) test applied to the two CDFs). See SI Figure 4 for similar results obtained with the SF filter.
